5 Optimize gridding params
Why aggregate data to grids?
In TransBigData, the gridding framework is determined by the gridding params. Each of the gridding params can define a griding coordinate system. The params are as follows:
params=(lonStart,latStart,deltaLon,deltaLat,theta)
However, how to choose an appropriate gridding params in our research is the most basic thing, which may have a great impact on the final analysis results.
A good idea is to input the urban road network data and optimize the grid parameters from the road network. However, for a gridding framework like TransBigData, this is not the best solution. The GPS data we want to analyze is not only the vehicle trajectory data and they do not have to follow a given road network. Moreover, the spatial feature of the road network is already included in the vehicle trajectory. Thus, the selection of gridding parameters should depend on the original spatial attributes of the GPS data.
When analysing individual mobility data, the optimal grid selection criteria are also different. Since individuals usually stay more time and generate more data in their activity points, a better gridding should match these data into the same grid. The result should be that few grids occupy more data.
Here, we offer three methods to optimize the griding params: centerdist, gini and gridscount
[1]:
import pandas as pd
import geopandas as gpd
import transbigdata as tbd
#Read taxi gps data
tripdata = pd.read_csv(r'data/TaxiData-Sample.csv')
tripdata.columns = ['track_id','time','lon','lat','OpenStatus','Speed']

#Retain the data in given area
area = gpd.read_file(r'data/gis/szarea1.json')
tripdata = tbd.clean_outofshape(tripdata,area,col=['lon','lat'])

#Generate initial griding params
bounds = [113.6,22.4,114.8,22.9]
initialparams = tbd.area_to_params(bounds,accuracy = 500)
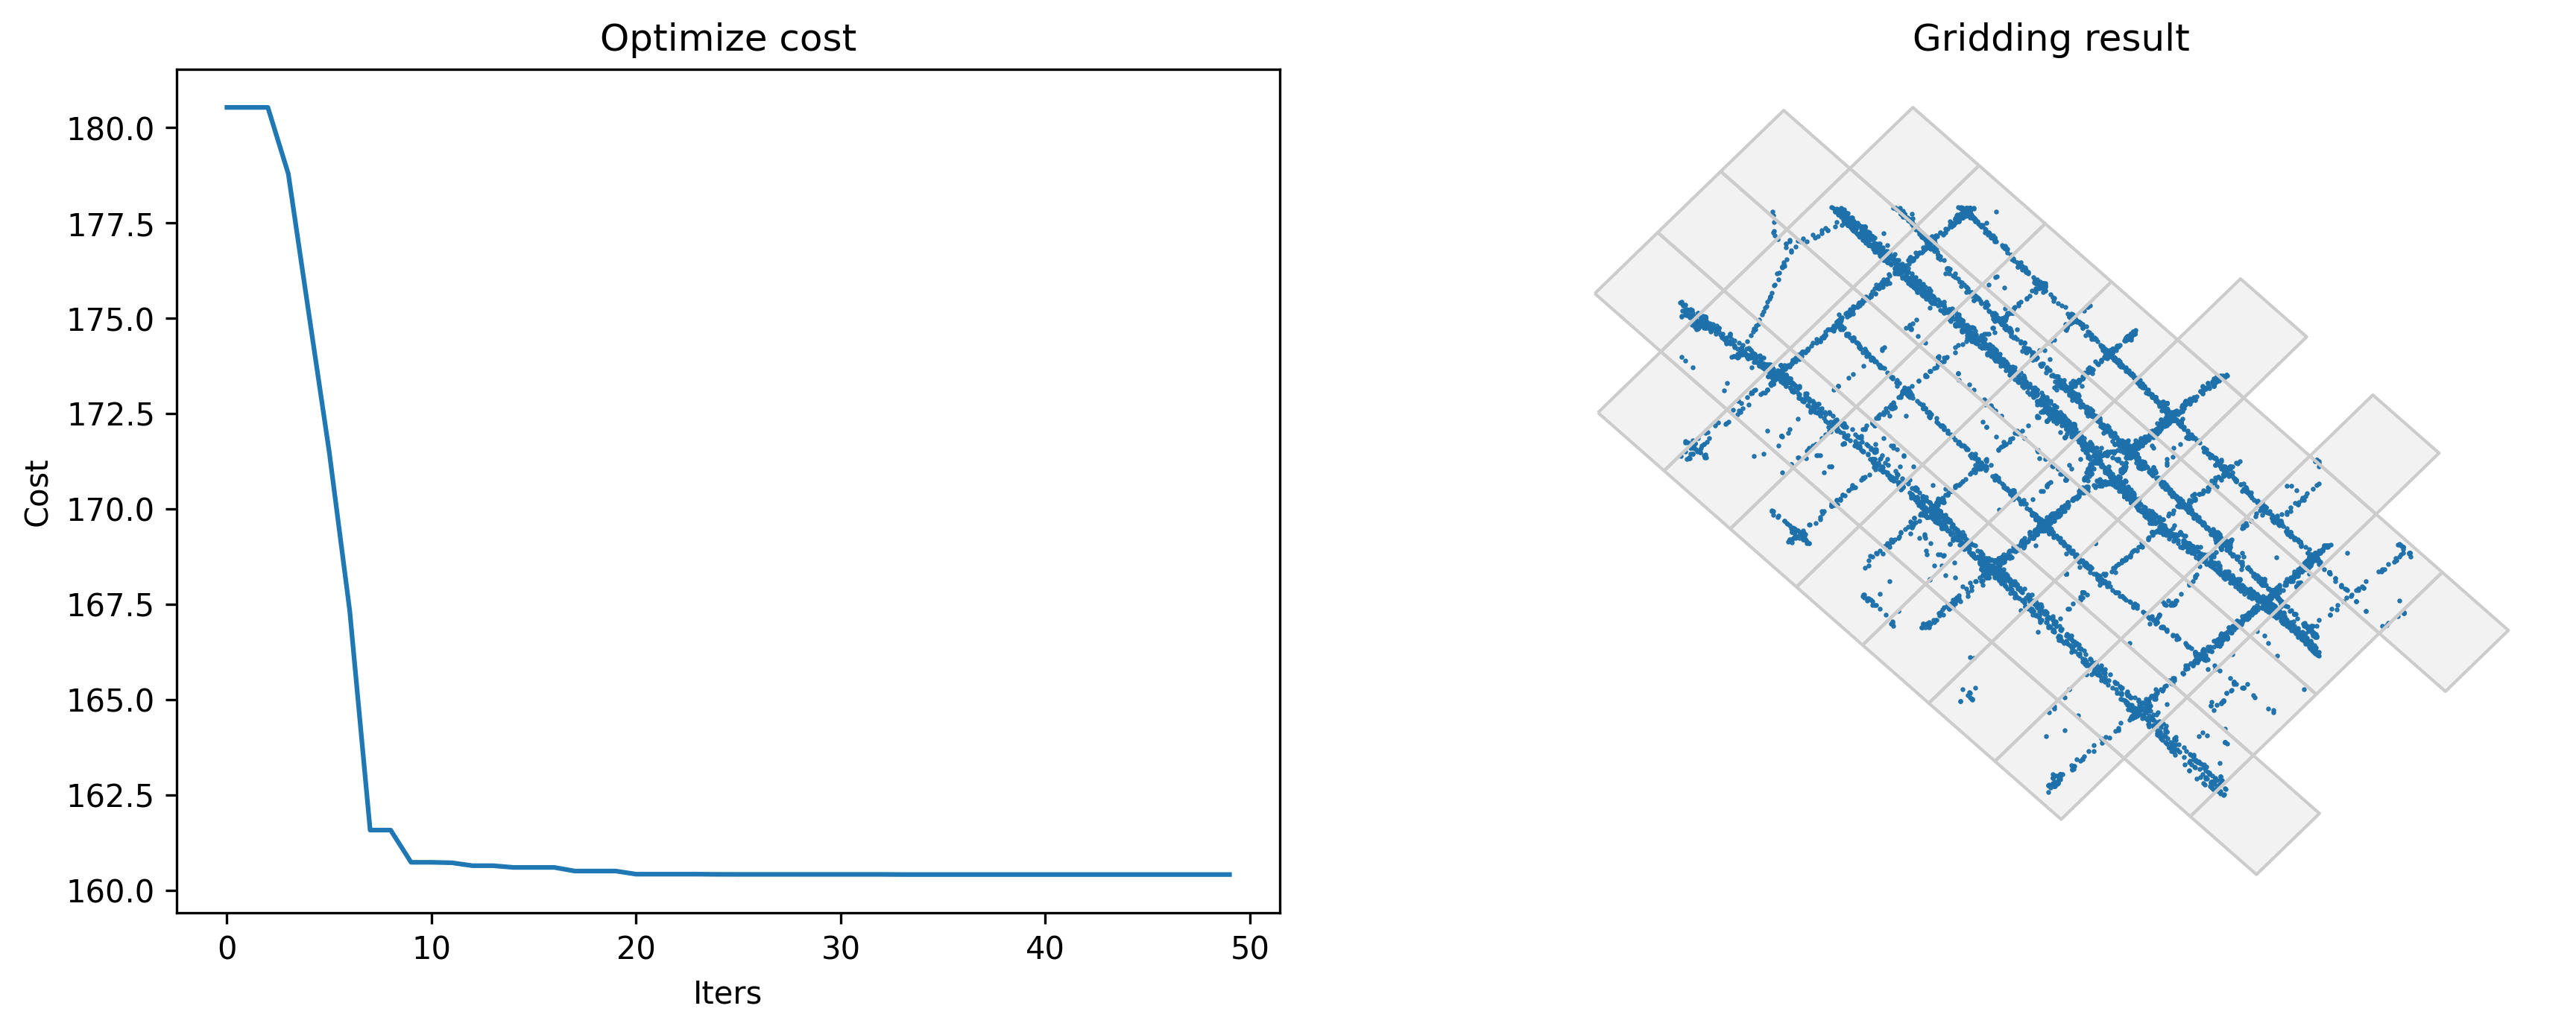
centerdist: Minimize the distance between grid center and GPS data
When a batch of data with close distance are distributed at the edge of the grid, the deviation of GPS data will cause these data to be matched into different grids. So one of the solution is to minimize the distance between grid center and GPS data.
[2]:
#Optimize gridding params
params_optimized = tbd.grid_params_optimize(tripdata,
                                            initialparams,
                                            col=['track_id','lon','lat'],
                                            optmethod='centerdist',
                                            sample=0, #not sampling
                                            printlog=True)
Optimized index centerdist: 160.41280636449184
Optimized gridding params: {'slon': 113.60144616975187, 'slat': 22.401543058590295, 'deltalon': 0.004872390756896538, 'deltalat': 0.004496605206422906, 'theta': 43.585298279322615, 'method': 'rect'}
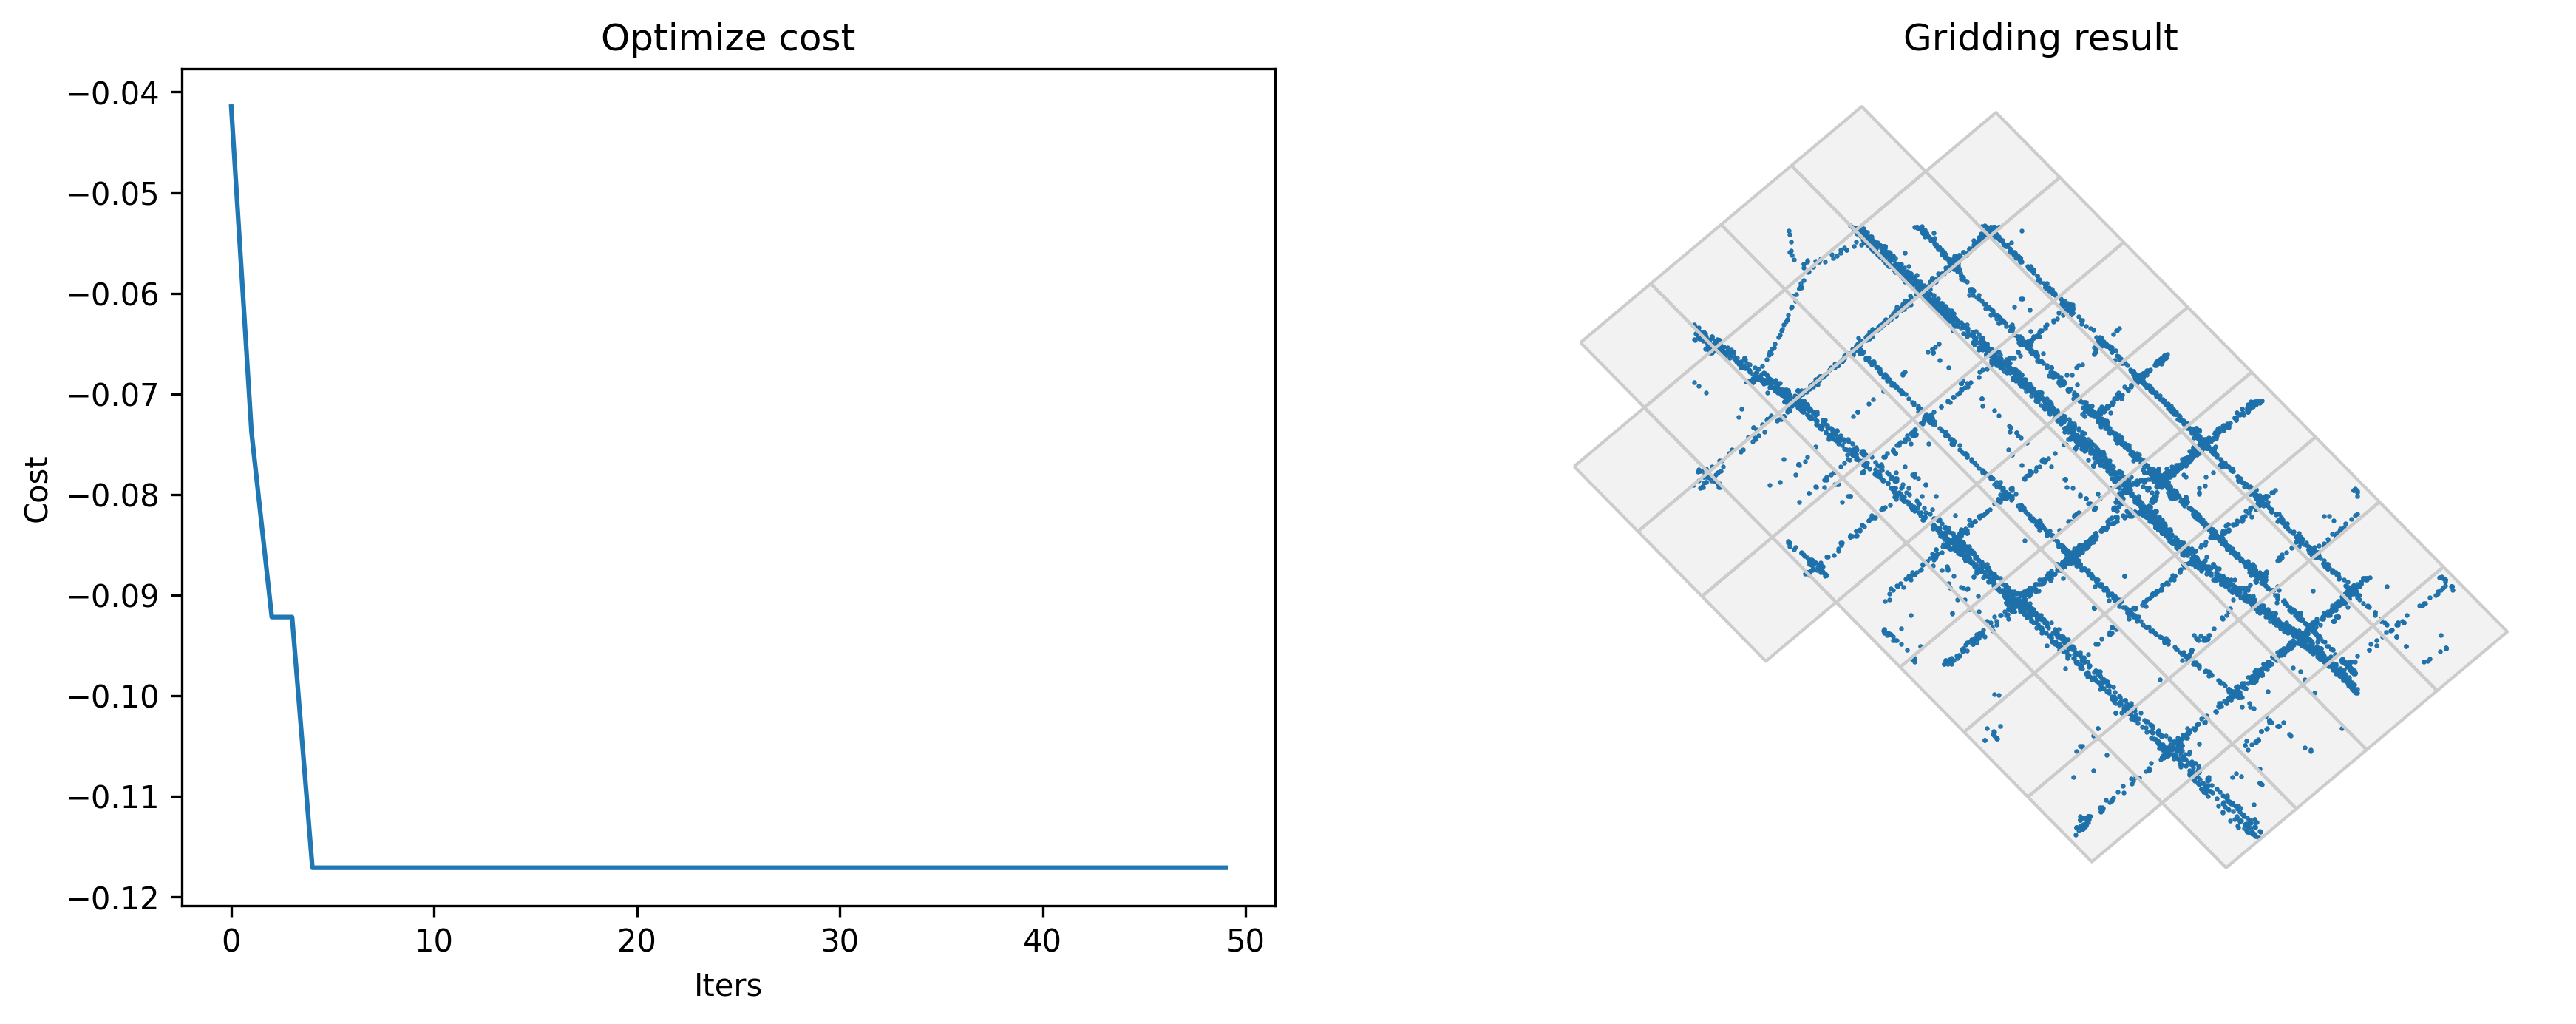
gini: Maximize the gini index
[3]:
#Optimize griding params
params_optimized = tbd.grid_params_optimize(tripdata,
                                            initialparams,
                                            col=['track_id','lon','lat'],
                                            optmethod='gini',
                                            sample=0, #not sampling
                                            printlog=True)
Optimized index gini: -0.11709661279249717
Optimized gridding params: {'slon': 113.60363252207824, 'slat': 22.40161914185426, 'deltalon': 0.004872390756896538, 'deltalat': 0.004496605206422906, 'theta': 47.730990684694575, 'method': 'rect'}
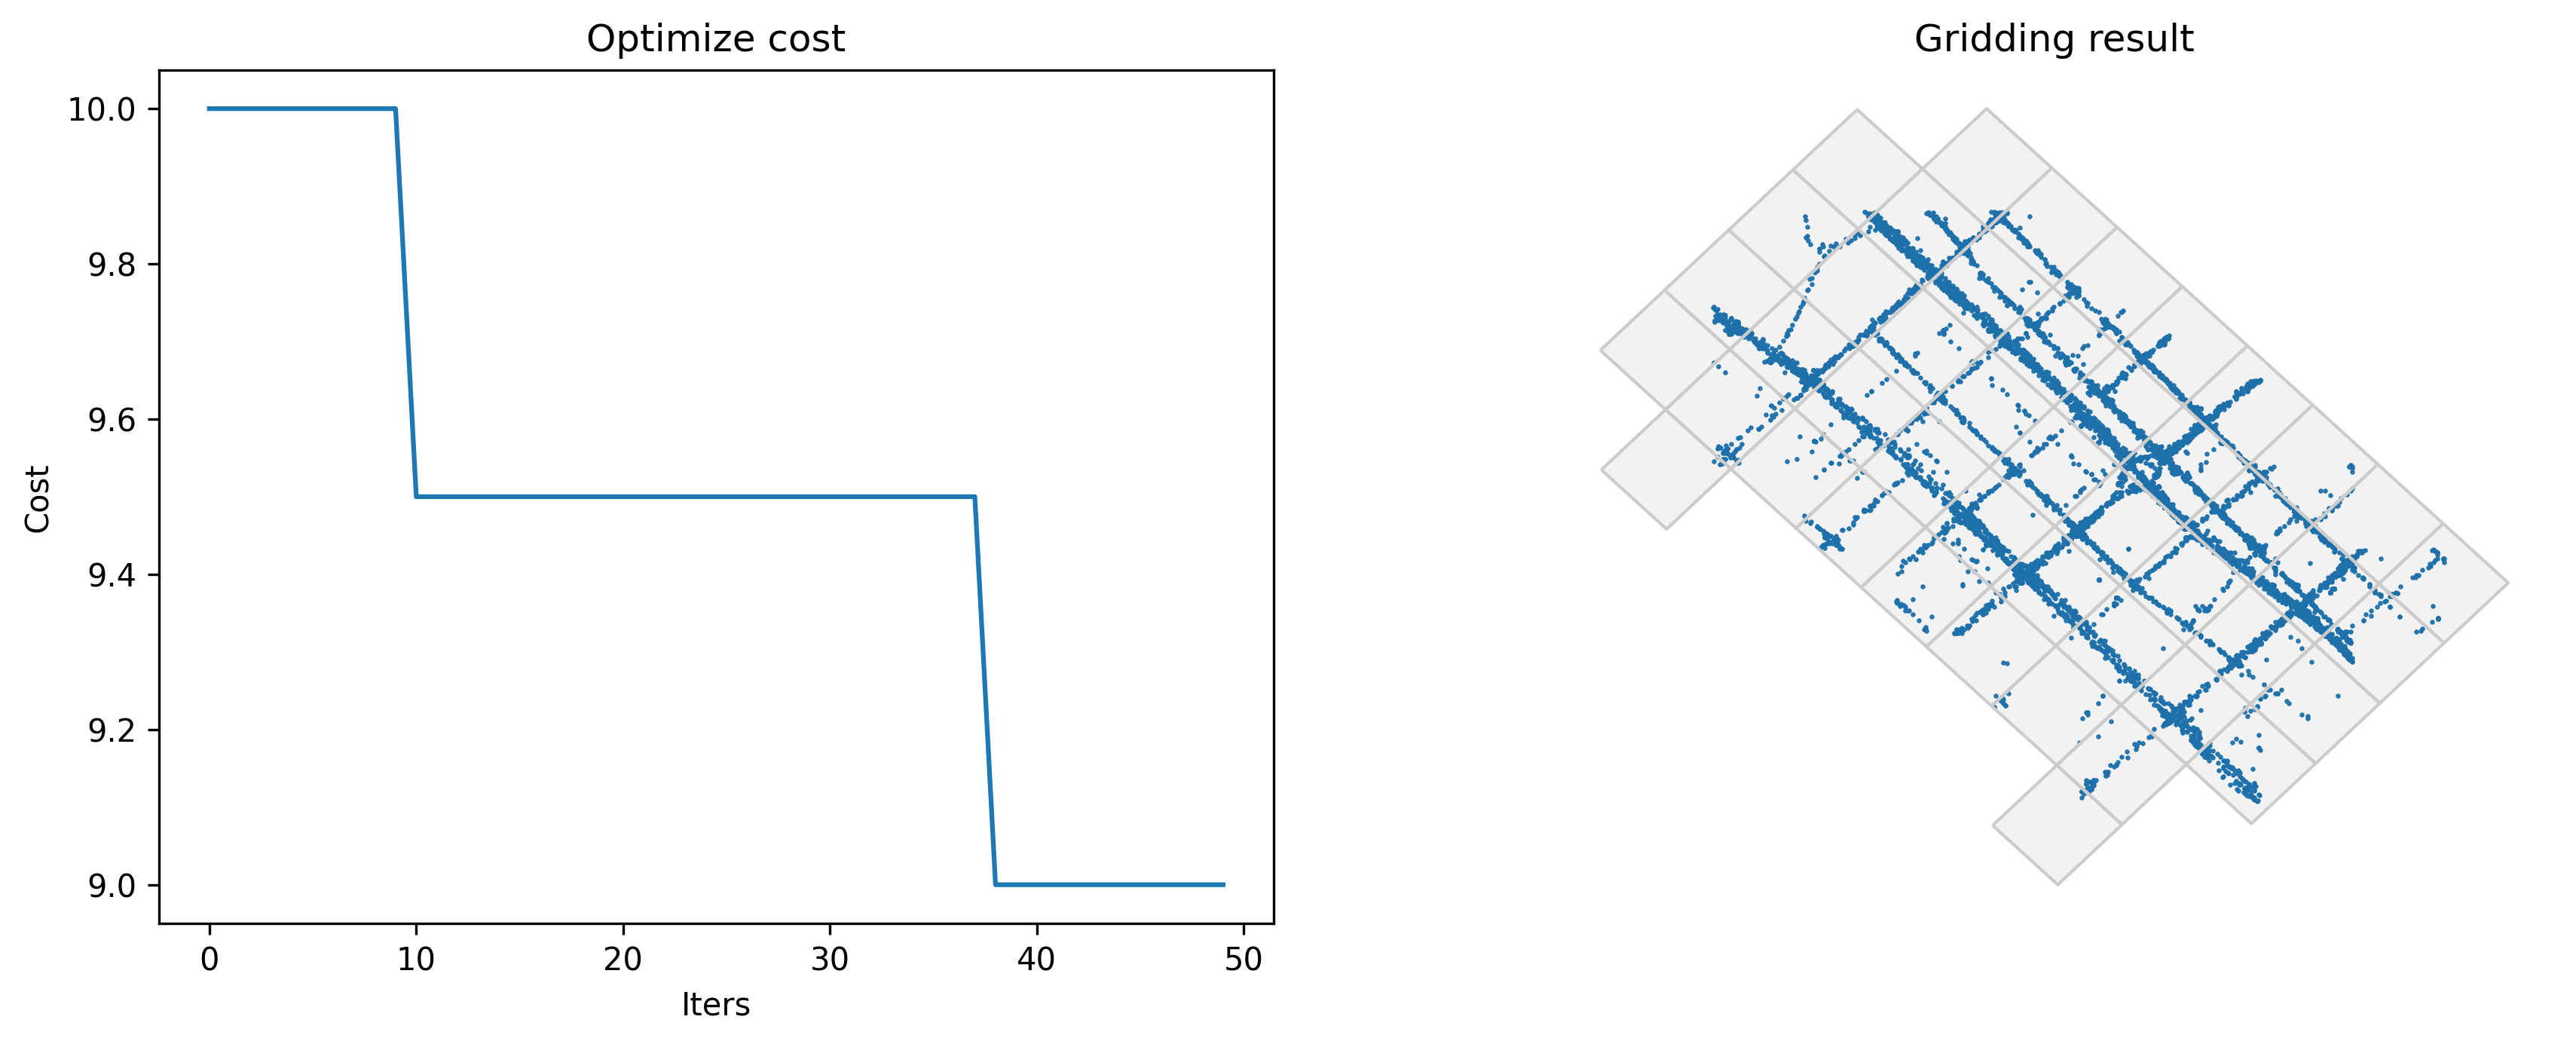
gridscount: Minimize the average count of grids for individuals
Under this standard, each individual should appear in as few grids as possible.
[4]:
#Optimize griding params
params_optimized = tbd.grid_params_optimize(tripdata,
                                            initialparams,
                                            col=['track_id','lon','lat'],
                                            optmethod='gridscount',
                                            sample=0, #not sampling
                                            printlog=True)
Optimized index gridscount: 9.0
Optimized gridding params: {'slon': 113.60372085909265, 'slat': 22.403002740815666, 'deltalon': 0.004872390756896538, 'deltalat': 0.004496605206422906, 'theta': 44.56000665402531, 'method': 'rect'}
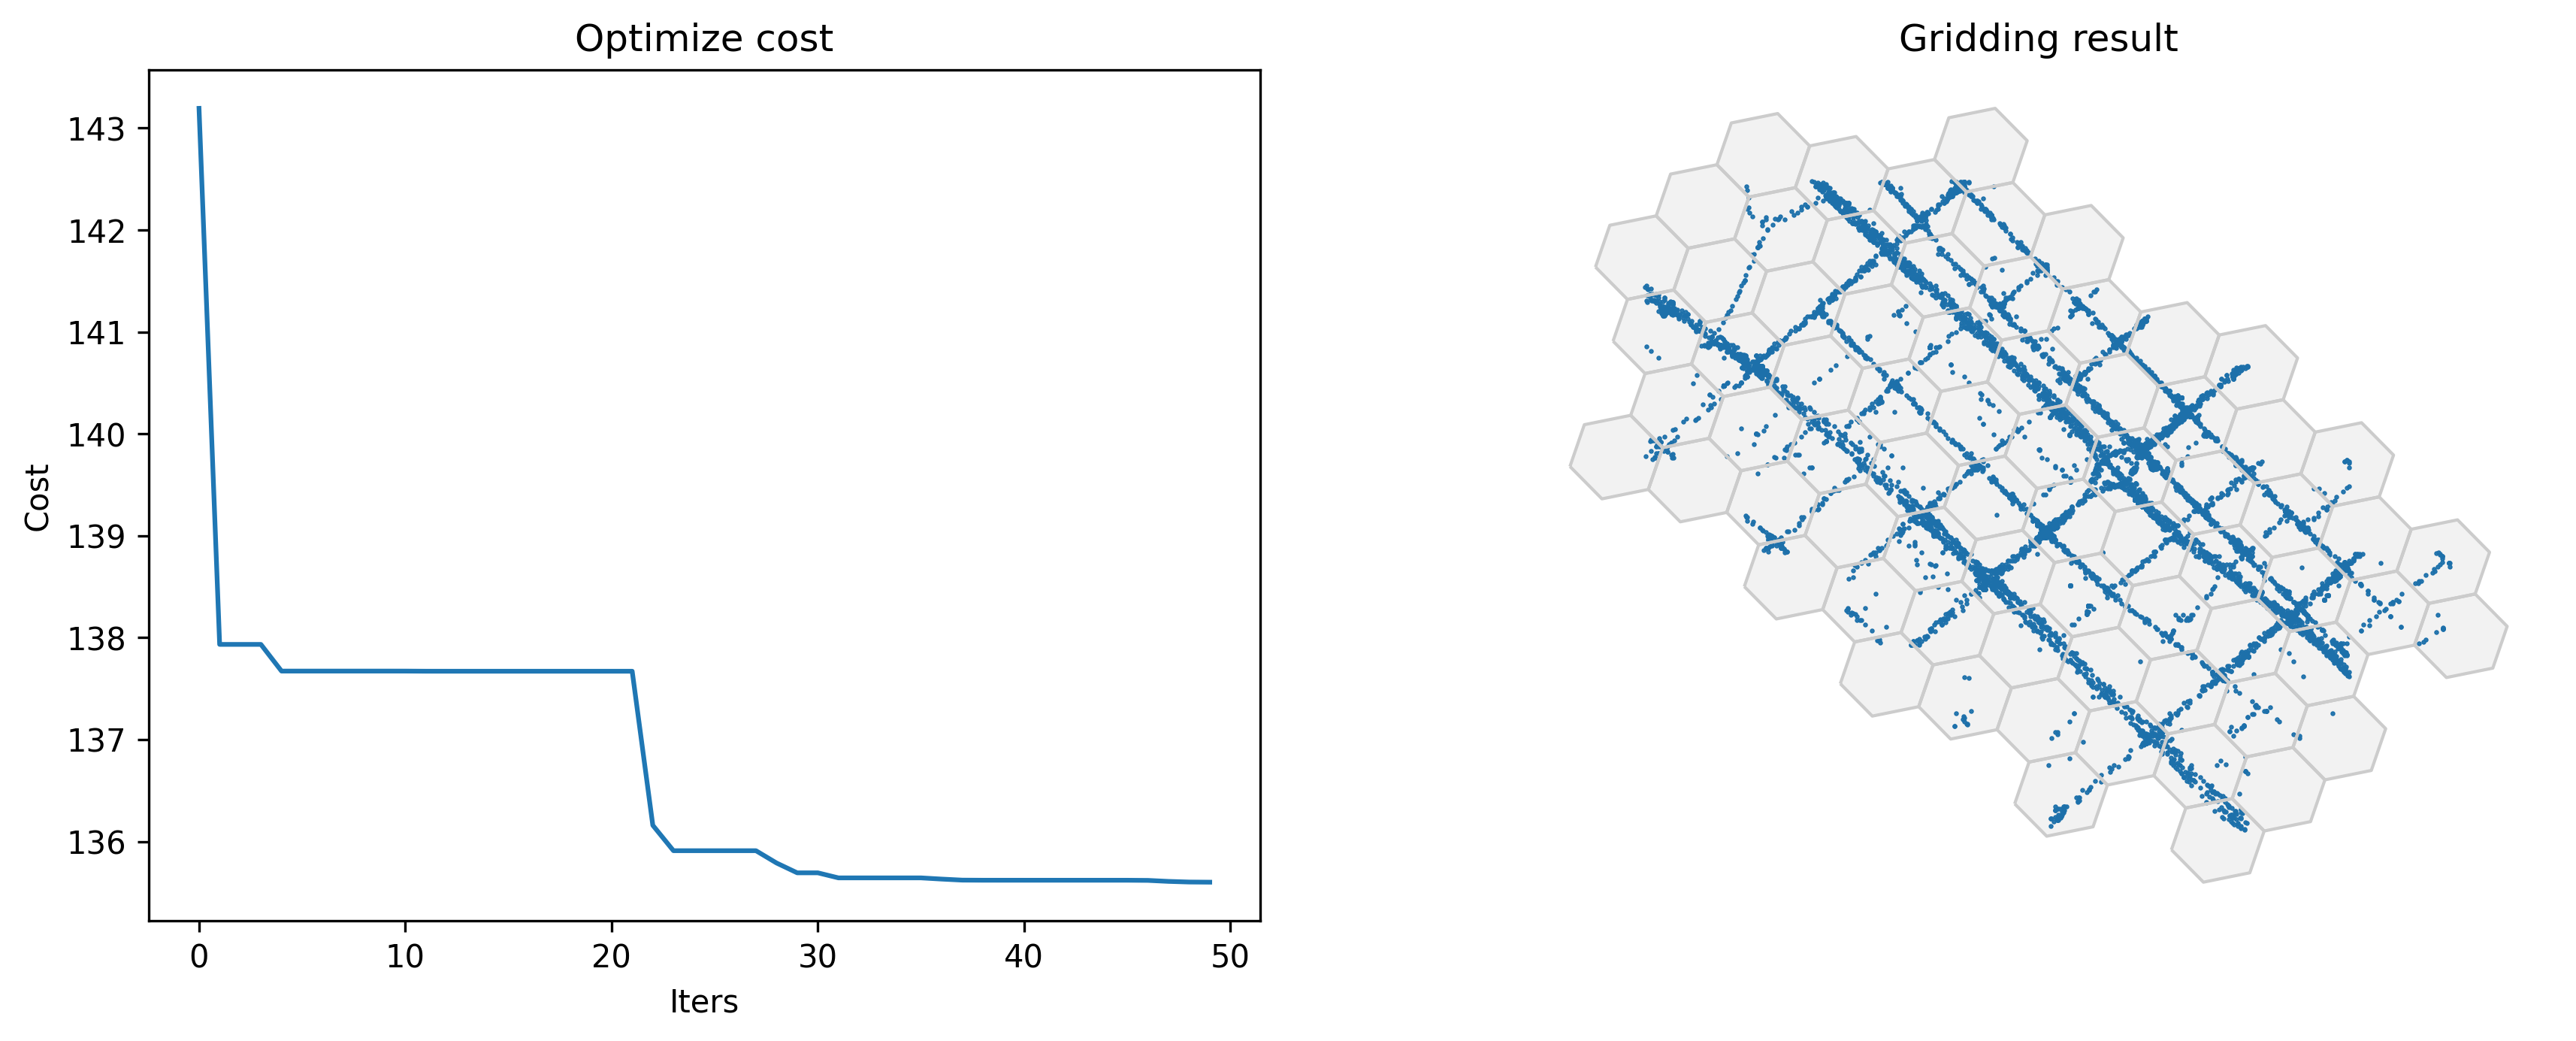
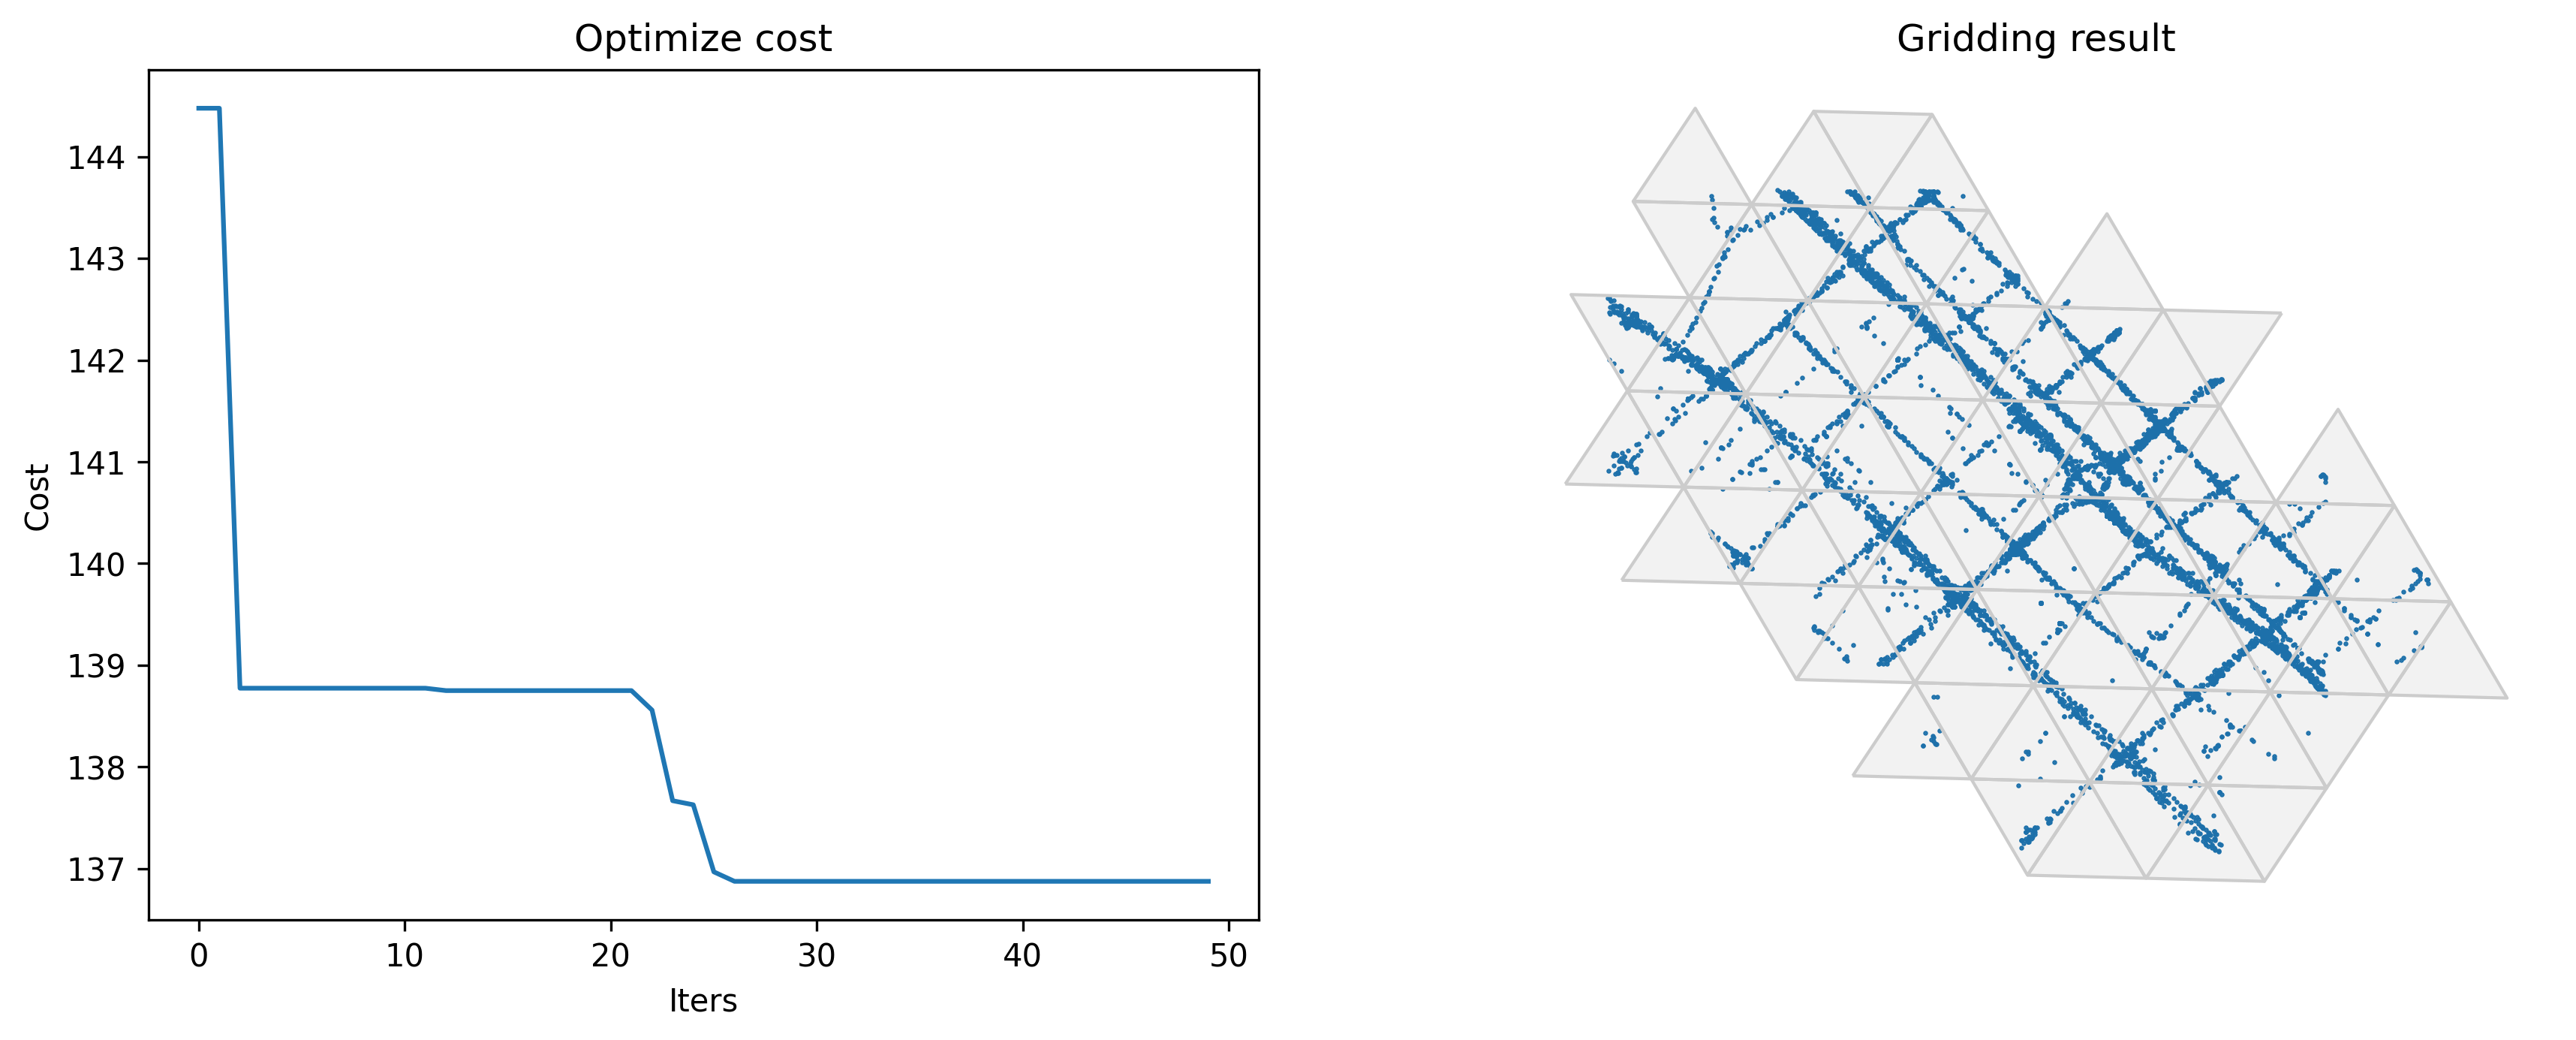
Also support optimizing triangle and hexagon gridding parameters
[5]:
initialparams['method'] = 'tri'
[6]:
#Optimize gridding params
params_optimized = tbd.grid_params_optimize(tripdata,
                                            initialparams,
                                            col=['track_id','lon','lat'],
                                            optmethod='centerdist',
                                            sample=0, #not sampling
                                            printlog=True)
Optimized index centerdist: 136.87564489047065
Optimized gridding params: {'slon': 113.60421146982776, 'slat': 22.402738210124514, 'deltalon': 0.004872390756896538, 'deltalat': 0.004496605206422906, 'theta': 31.61303640854649, 'method': 'tri'}
[7]:
initialparams = tbd.area_to_params(bounds,accuracy = 500/(6**0.5))
initialparams['method'] = 'hexa'
[8]:
#Optimize gridding params
params_optimized = tbd.grid_params_optimize(tripdata,
                                            initialparams,
                                            col=['track_id','lon','lat'],
                                            optmethod='centerdist',
                                            sample=0, #not sampling
                                            printlog=True)
Optimized index centerdist: 135.60103782128888
Optimized gridding params: {'slon': 113.60043088516572, 'slat': 22.400303375881162, 'deltalon': 0.0019891451969749397, 'deltalat': 0.0018357313884130575, 'theta': 17.62535531106509, 'method': 'hexa'}