Load the basemap
|
Plot the basemap |
|
Add compass and scale for a map |
|
|
|
Set savepath for maps |
Read map savepath |
|
Read mapboxtoken |
Settings before start
If you have obtained the mapbox token, you can use the following code to set the mapbox token for TransBigData (you only need to set it once, and you don’t need to reset it when you reopen python later)
import transbigdata as tbd
#Set your mapboxtoken with the following code
tbd.set_mapboxtoken('pk.eyxxxxxxxxxx.xxxxxxxxx')
# The token you applied for must be set in it.
# Copying this line of code directly is invalid
In addition, you need to set the storage location of a map basemap. When the same location is displayed next time, the map will be read and loaded locally
# Set your map basemap storage path
# On linux or mac, the path is written like this.
# Note that there is a backslash at the end
tbd.set_imgsavepath(r'/Users/xxxx/xxxx/')

# On windows, the path is written like this.
# Finally, pay attention to two slashes to prevent escape
tbd.set_imgsavepath(r'E:\pythonscript\xxx\\')
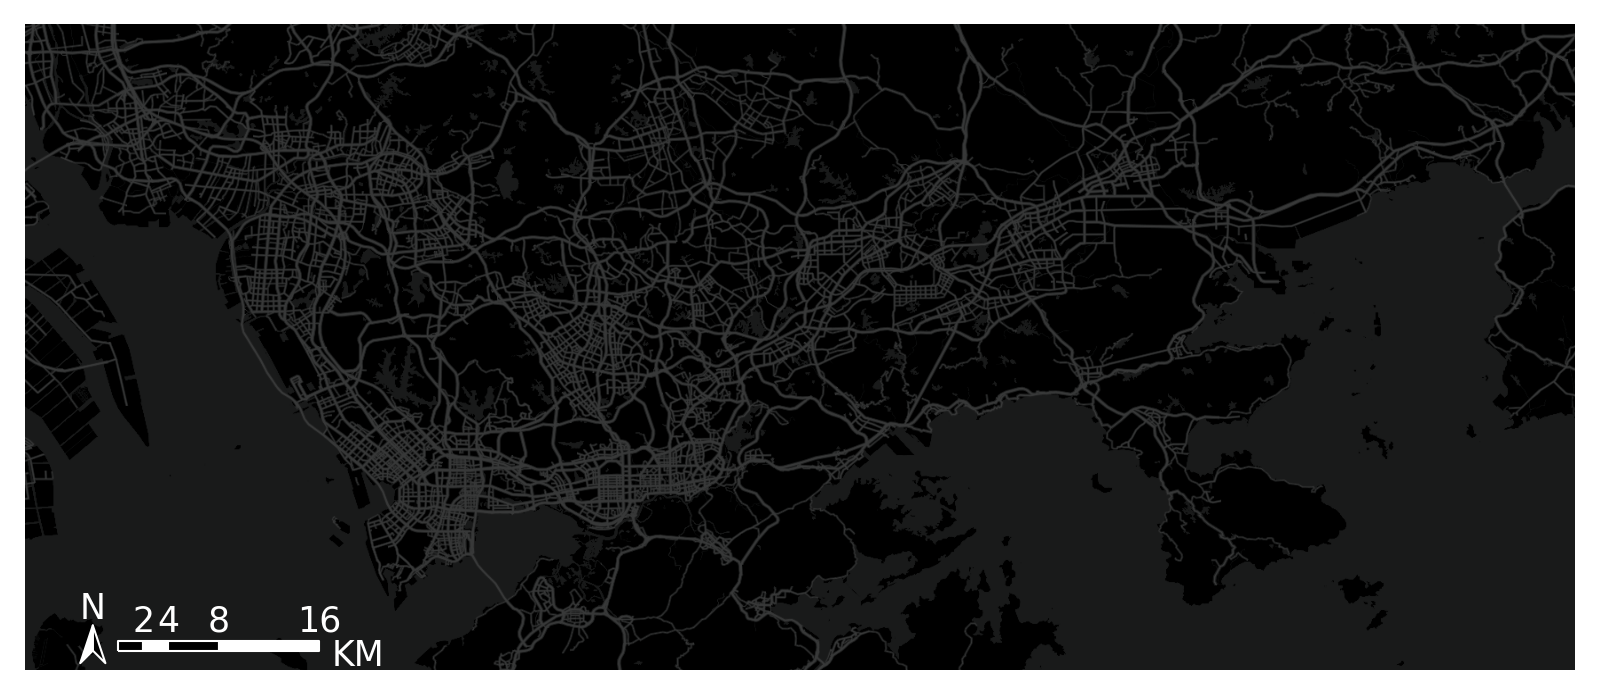
After setting, the next time you draw the base map, you will create a tileimg folder under the path you set, and put all the base maps in it. Try the following code to see if you can draw the base map successfully
# Define display range
bounds = [113.6,22.4,114.8,22.9]
# Plot Frame
import matplotlib.pyplot as plt
fig =plt.figure(1,(8,8),dpi=250)
ax =plt.subplot(111)
plt.sca(ax)
# Add map basemap
tbd.plot_map(plt,bounds,zoom = 11,style = 4)
# Add scale bar and north arrow
tbd.plotscale(ax,bounds = bounds,textsize = 10,compasssize = 1,accuracy = 2000,rect = [0.06,0.03],zorder = 10)
plt.axis('off')
plt.xlim(bounds[0],bounds[2])
plt.ylim(bounds[1],bounds[3])
plt.show()
- transbigdata.plot_map(plt, bounds, zoom='auto', style=0, printlog=False)
Plot the basemap
- Parameters:
plt (matplotlib.pyplot) – Where to plot
bounds (List) – The drawing boundary of the base map, [lon1,lat1,lon2,lat2] (WGS84 coordinate system), where lon1 and lat1 are the coordinates of the lower left corner and lon2 and lat2 are the coordinates of the upper right corner
zoom (number) – The larger the magnification level of the base map, the longer the loading time. Generally, the range for a single city is between 12 and 16
printlog (bool) – Show log
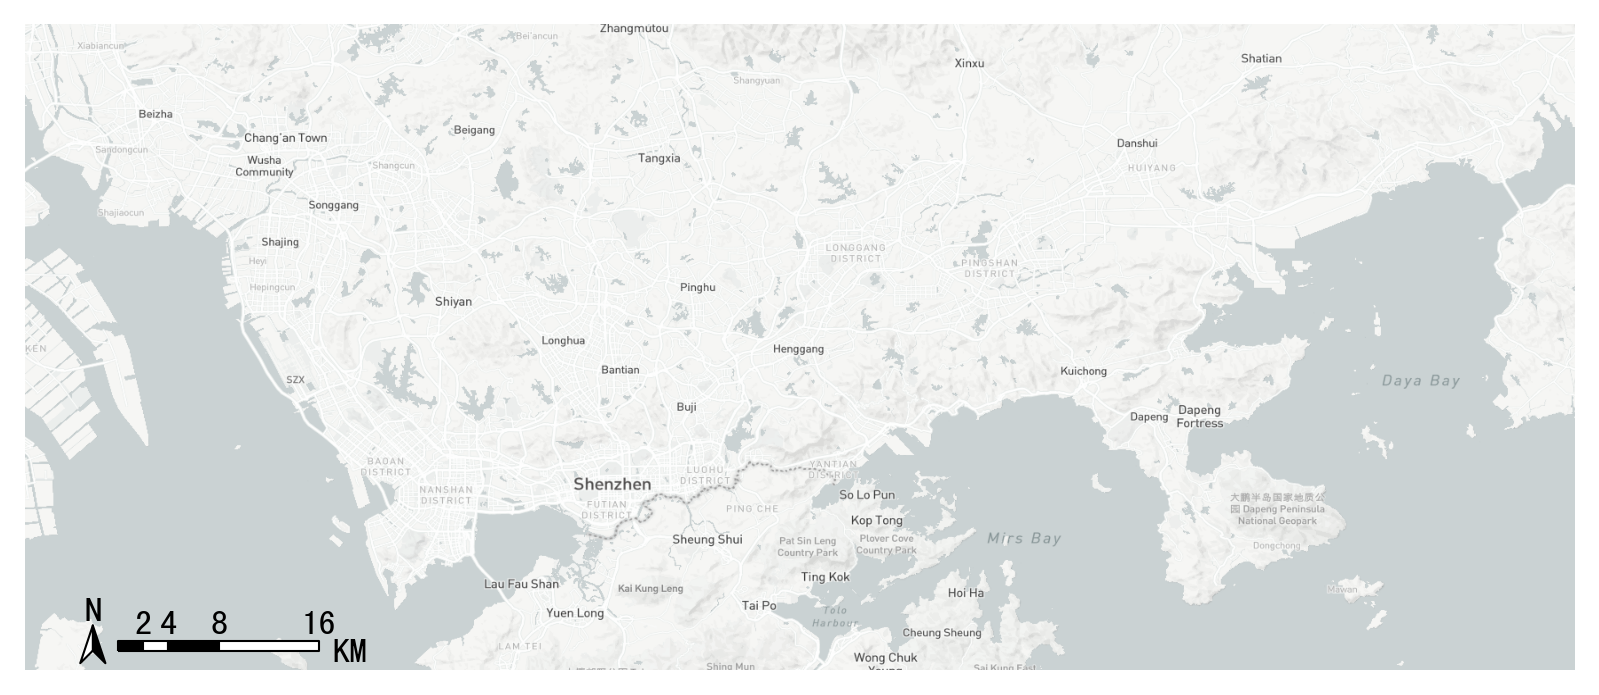
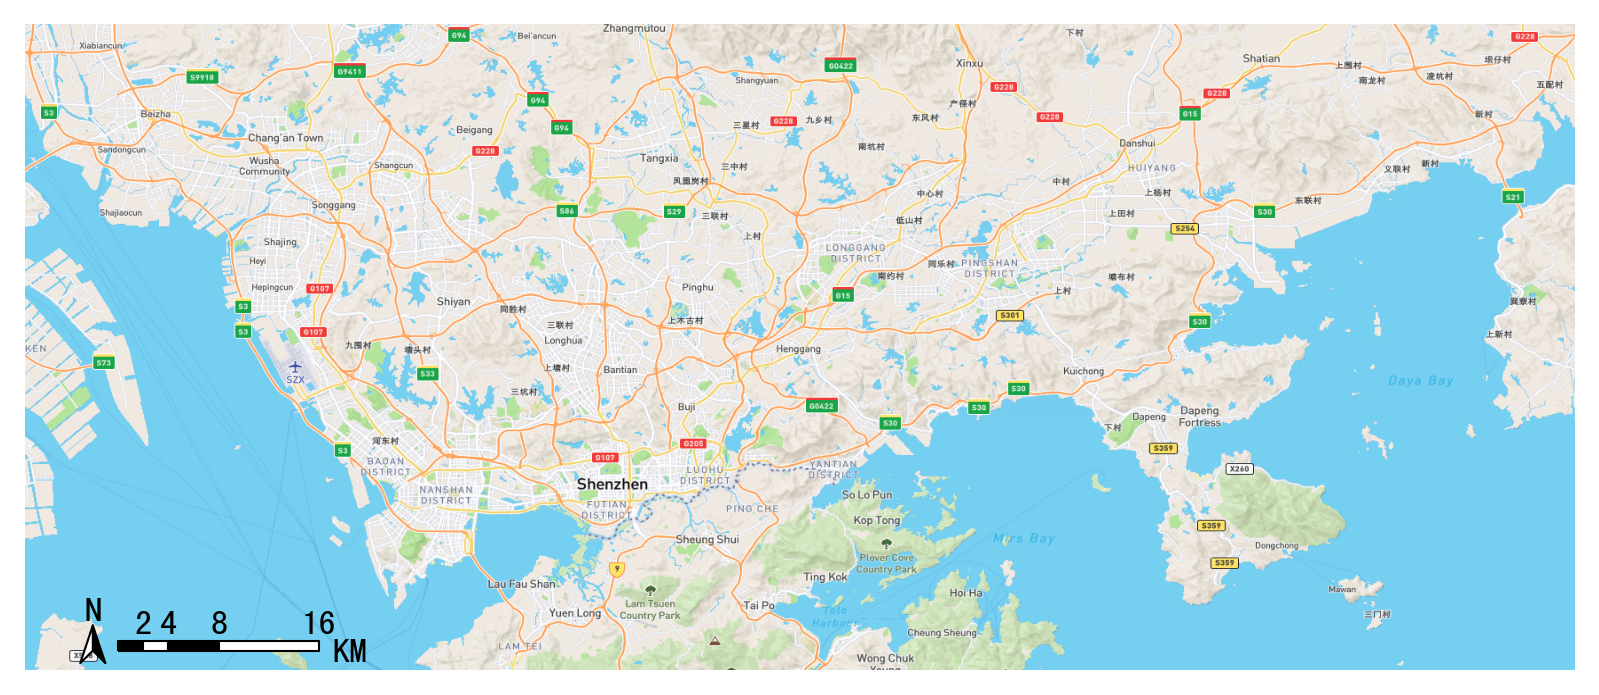
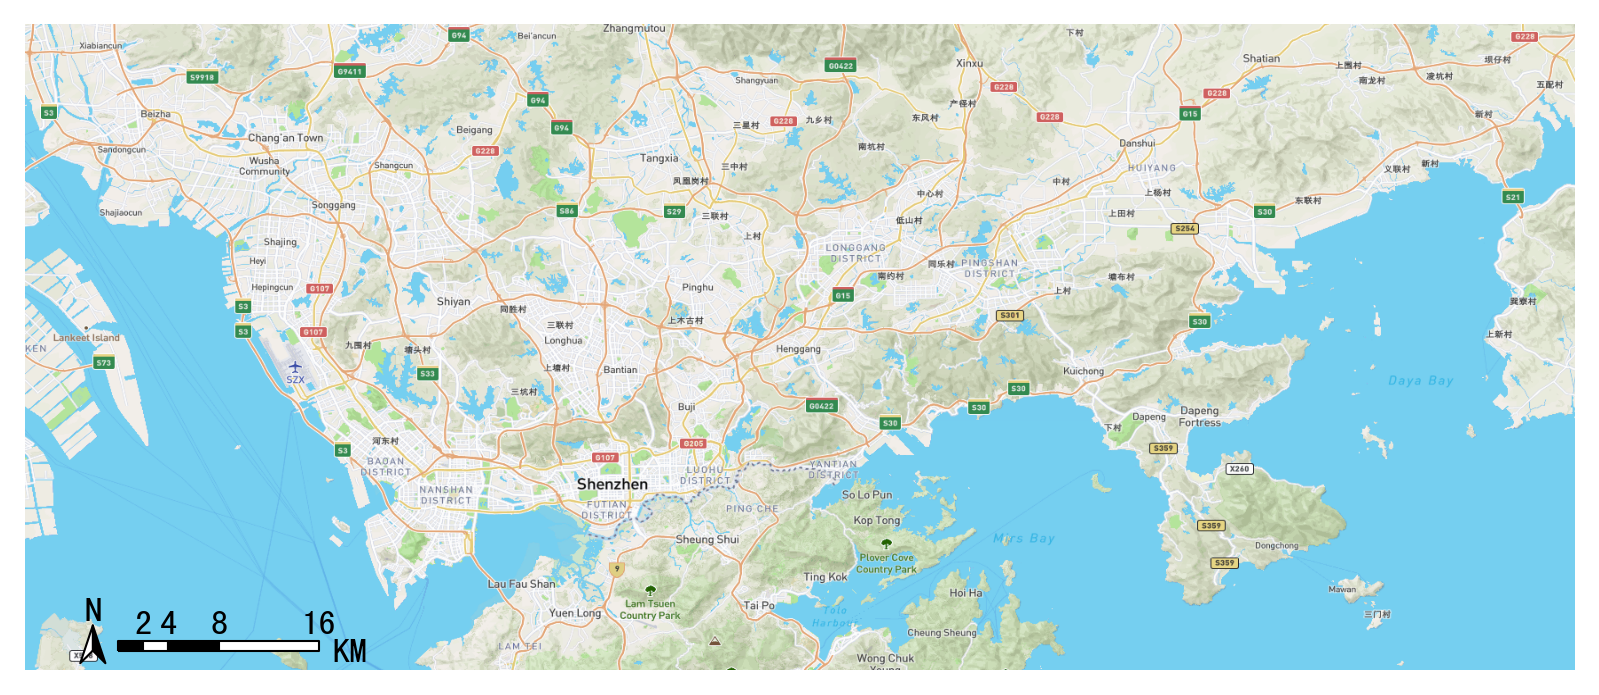
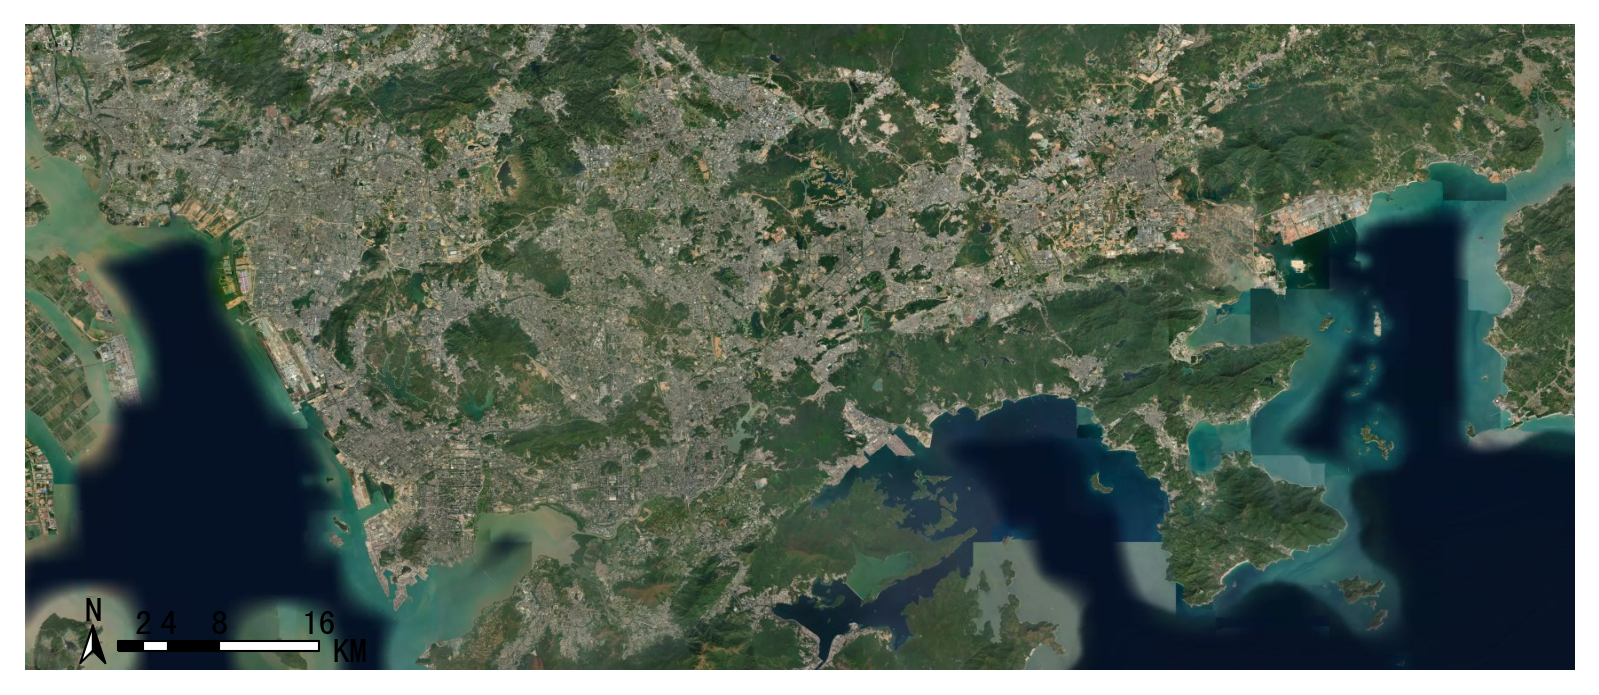
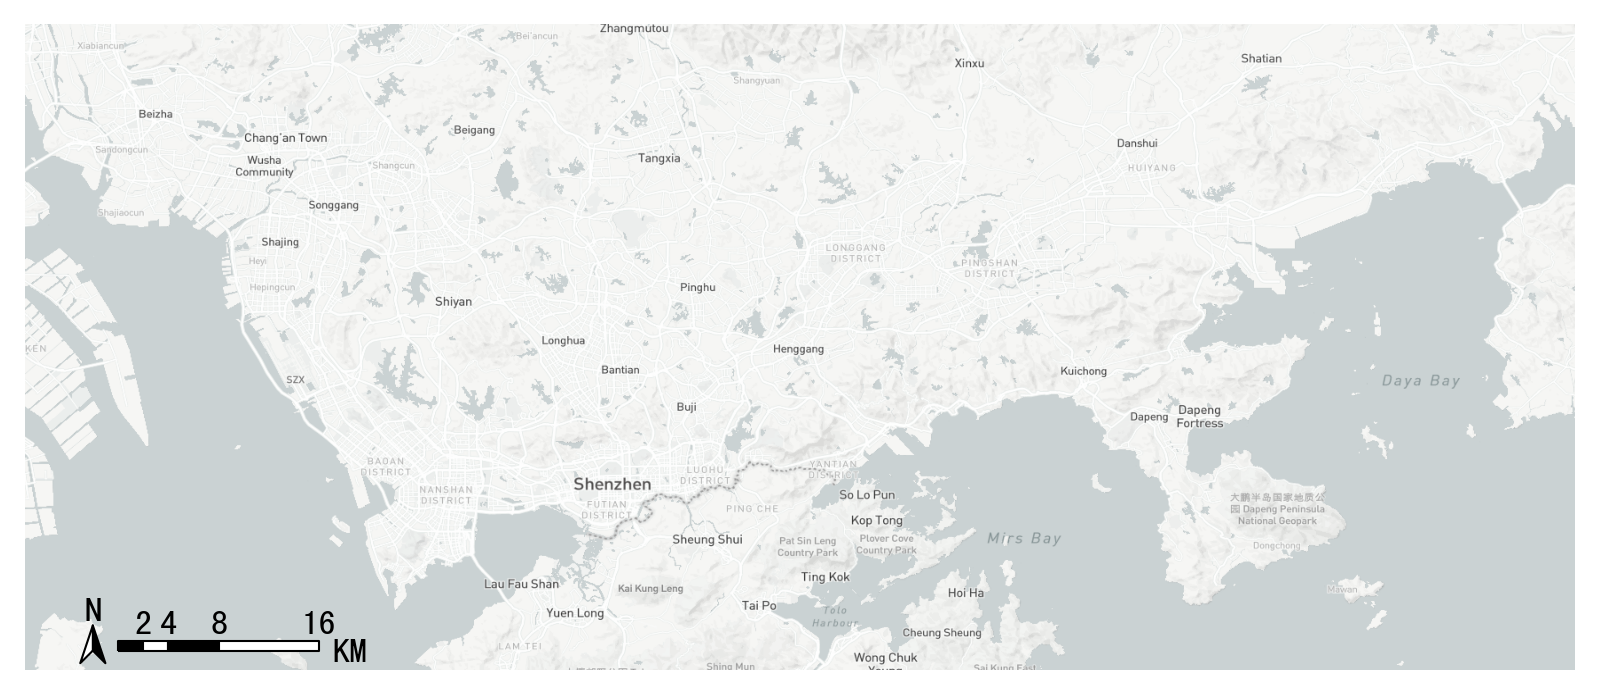
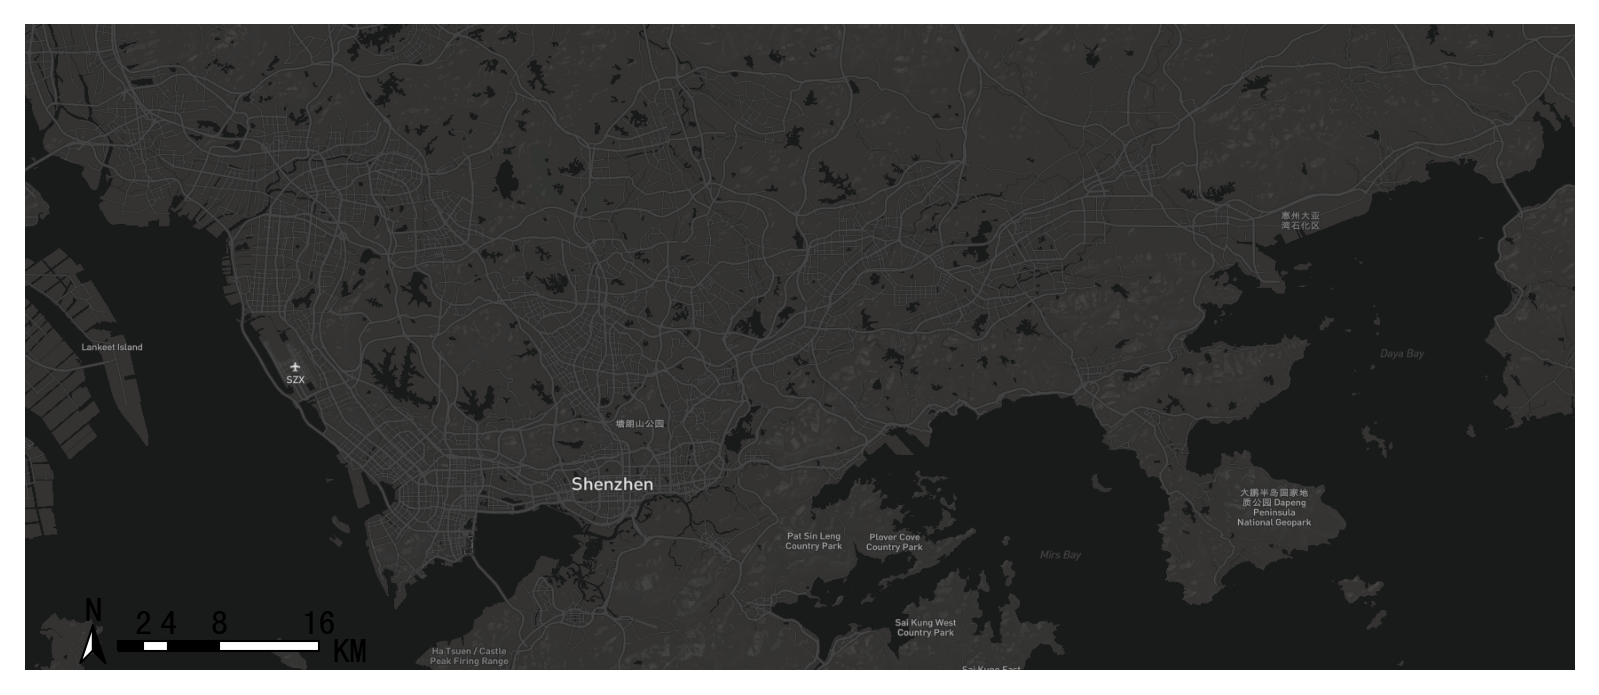
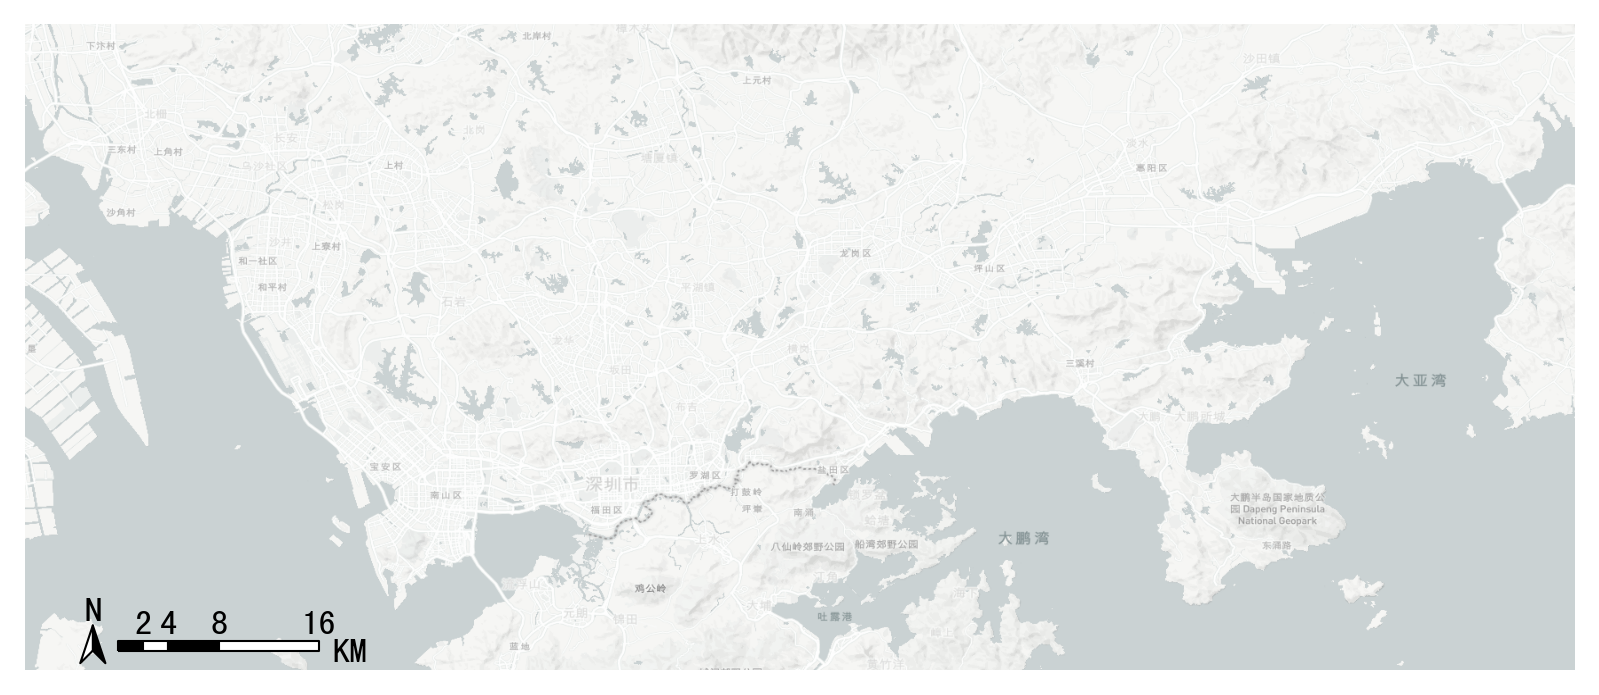
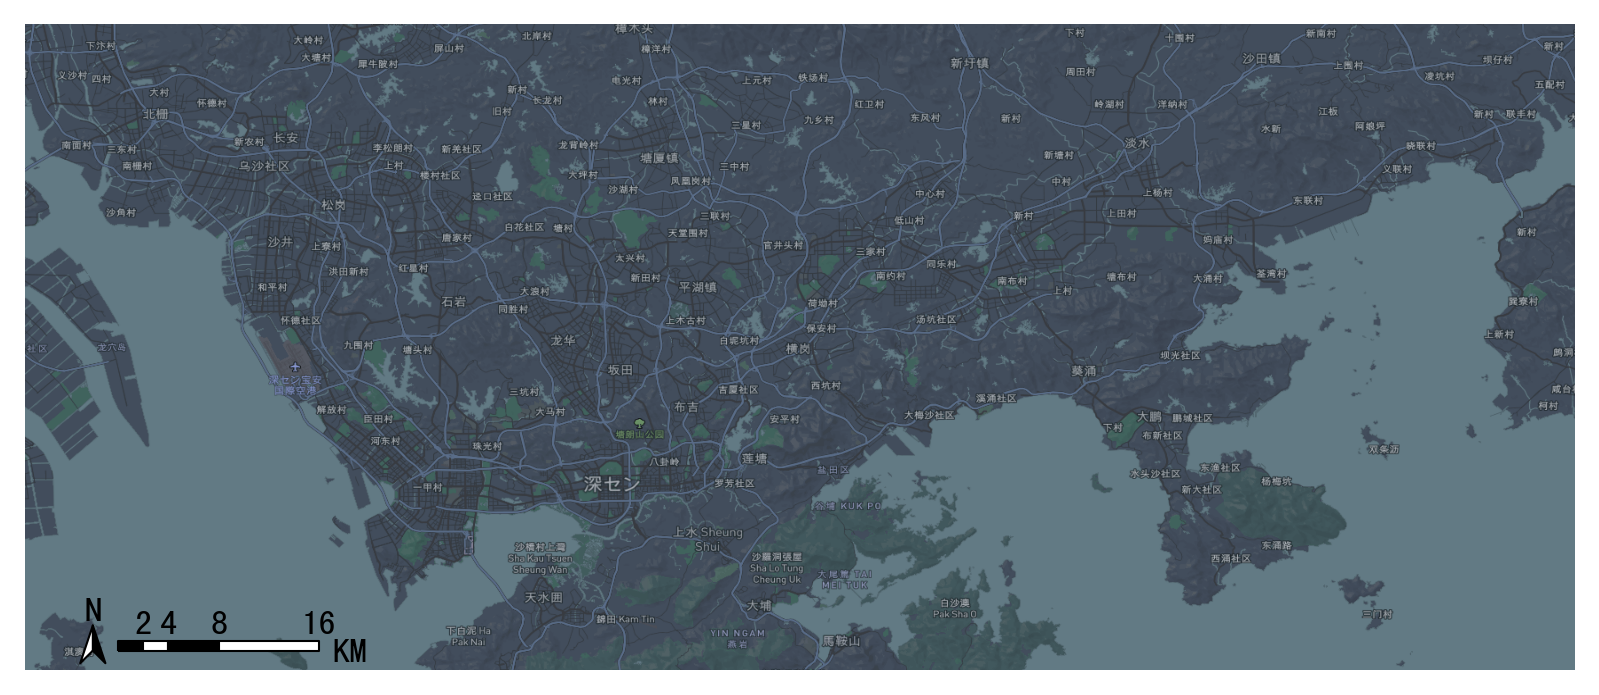
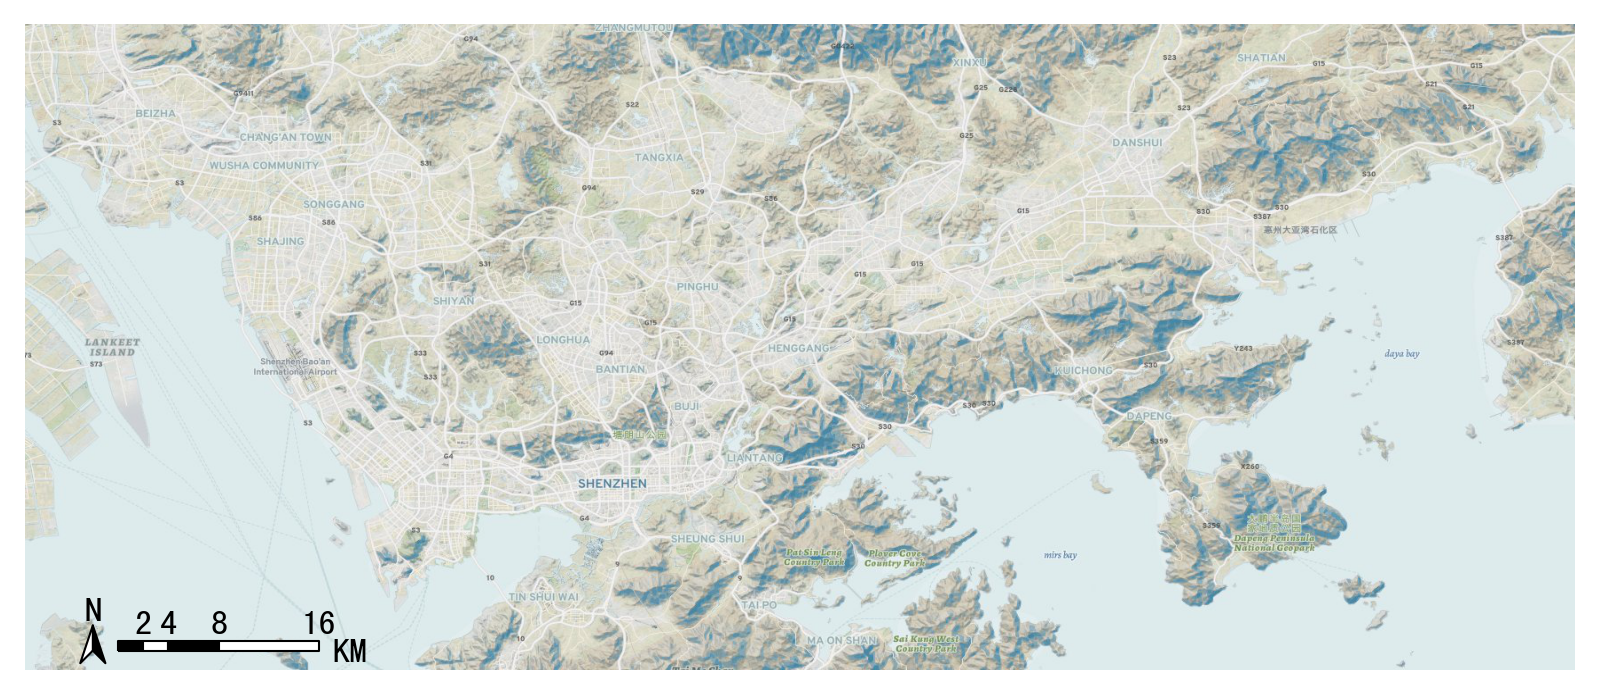
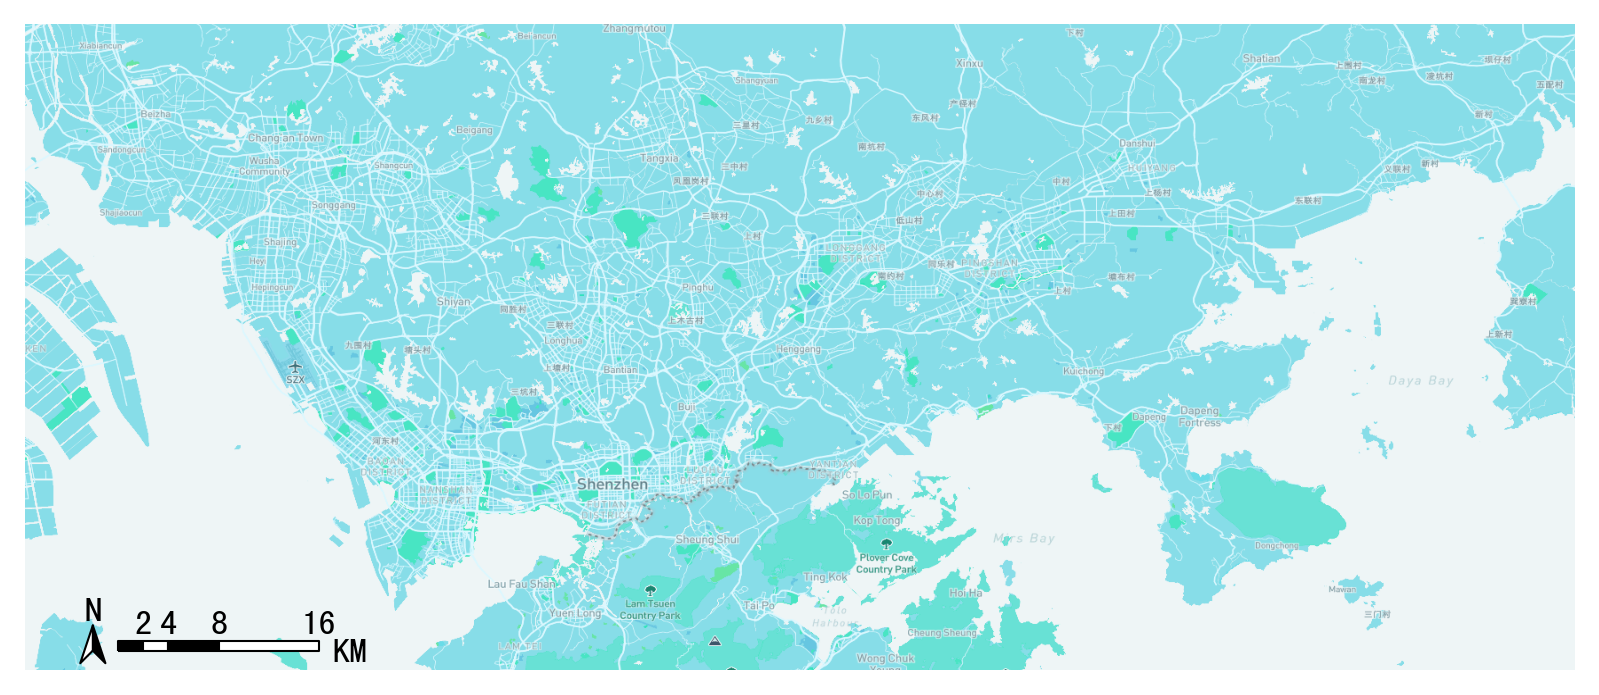
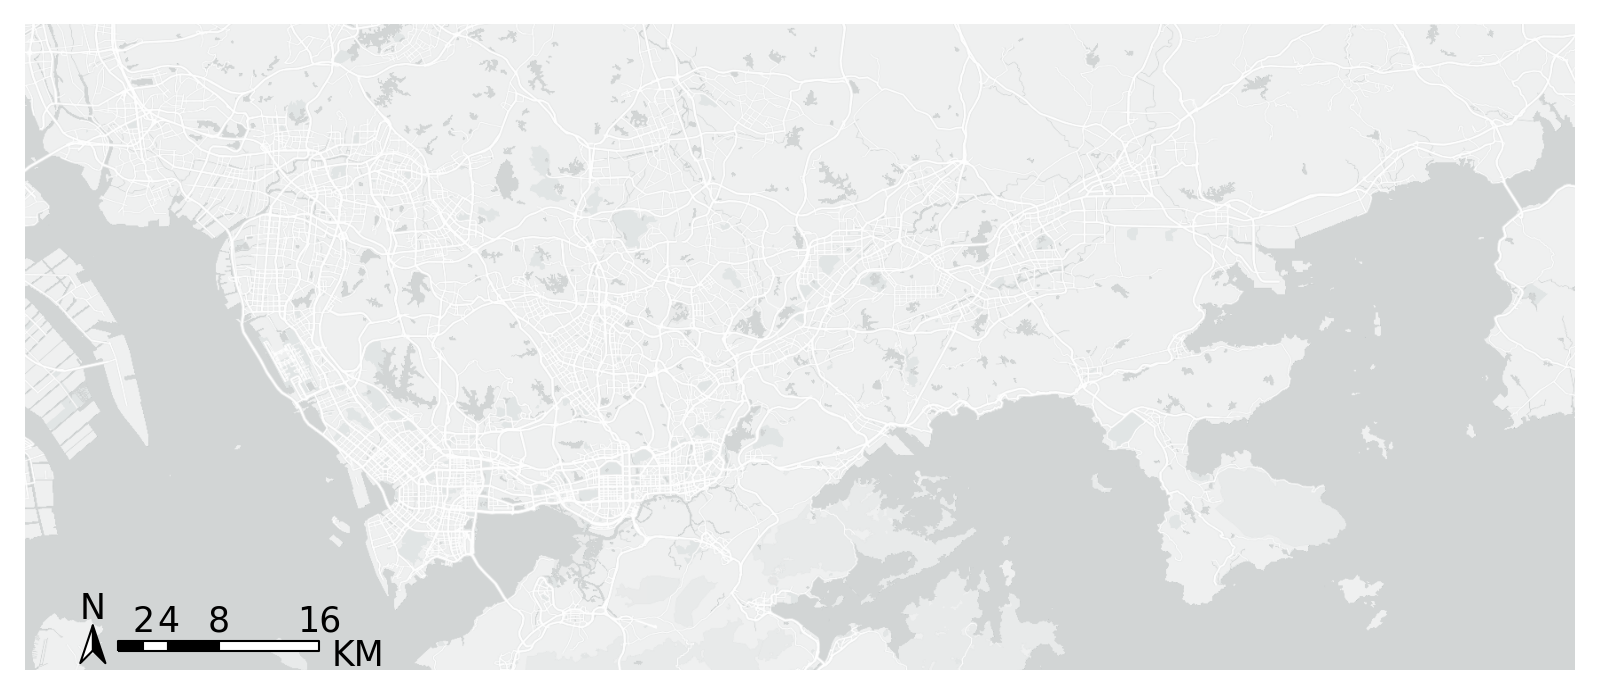
style (number) – The style of map basemap can be 1-10, as follows
Basemap style 1:streets
Basemap style 2:outdoors
Basemap style 3:satellite
Basemap style 4:light
Basemap style 5:dark
Basemap style 6:light-ch(中文)
Basemap style 7:ice creem
Basemap style 8:night
Basemap style 9:terrain
Basemap style 10:basic blue
Basemap style 11:light(无标注)
Basemap style 12:dark(无标注)
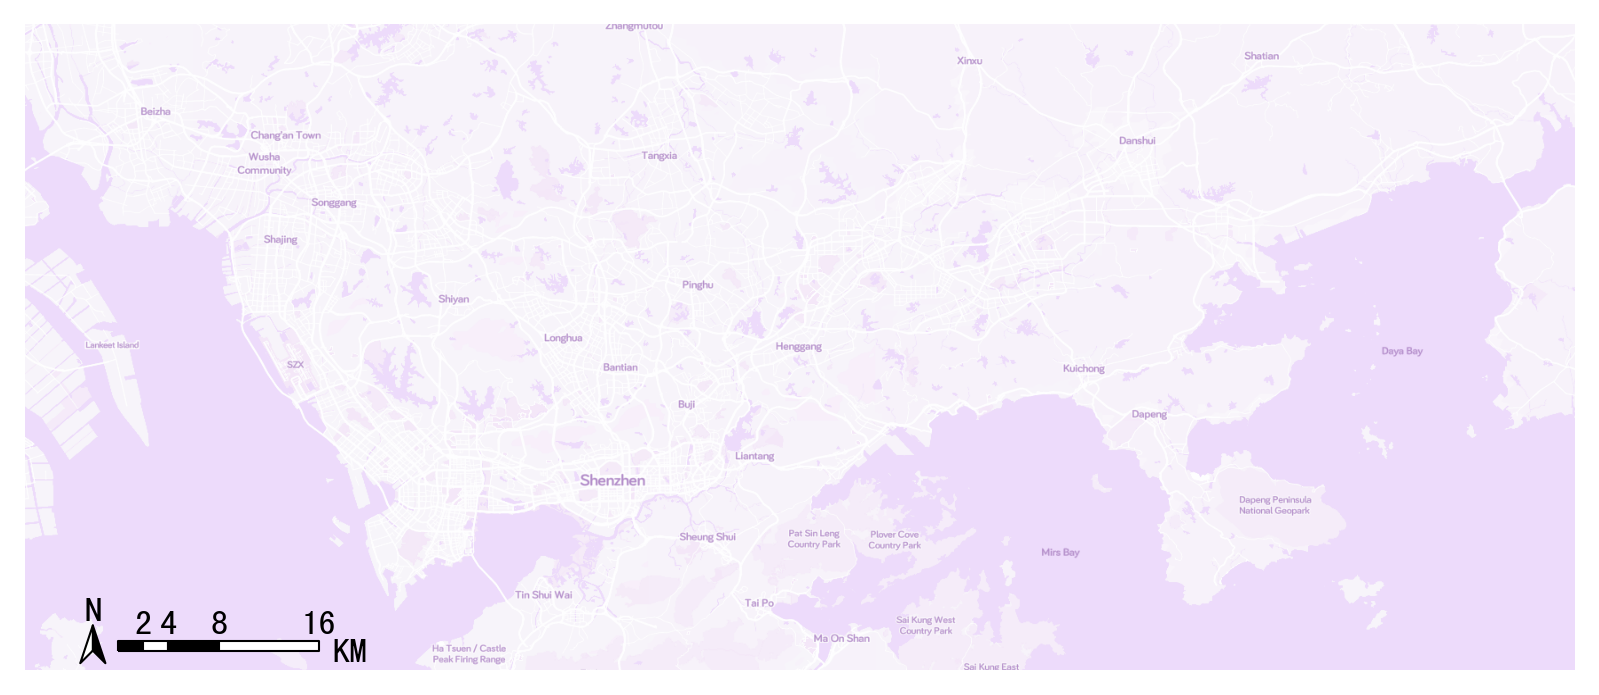
Self-defined style
support selfdefined mapbox style
tbd.plot_map(plt,bounds,zoom = 11,style = 'mapbox://styles/ni1o1/cl38pljx0006r14qp7ioy7gcc')
Compass and scale
- transbigdata.plotscale(ax, bounds, textcolor='k', textsize=8, compasssize=1, accuracy='auto', rect=[0.1, 0.1], unit='KM', style=1, **kwargs)
Add compass and scale for a map
- Parameters:
bounds (List) – The drawing boundary of the base map, [lon1,lat1,lon2,lat2] (WGS84 coordinate system), where lon1 and lat1 are the coordinates of the lower left corner and lon2 and lat2 are the coordinates of the upper right corner
textsize (number) – size of the text
compasssize (number) – size of the compass
accuracy (number) – Length of scale bar (m)
unit (str) – ‘KM’,’km’,’M’,’m’, the scale units
style (number) – 1 or 2, the style of the scale
rect (List) – The approximate position of the scale bar in the figure, such as [0.9,0.9], is in the upper right corner
tbd.plotscale(ax,bounds = bounds,textsize = 10,compasssize = 1,accuracy = 2000,rect = [0.06,0.03])