4 Generate and rotate triangle and hexagon grids
In this example, we will introduce more options for TransBigData grid processing, including: - Adding rotation angle. - Triangle and hexagon grids.
Rotate the grids
[1]:
#Read taxi gps data
import transbigdata as tbd
import pandas as pd
data = pd.read_csv('data/TaxiData-Sample.csv',header = None)
data.columns = ['VehicleNum','time','lon','lat','OpenStatus','Speed']
#Define the study area
bounds = [113.75, 22.4, 114.62, 22.86]
#Delete the data out of the study area
data = tbd.clean_outofbounds(data,bounds = bounds,col = ['lon','lat'])
The grid coordinates system offer by
TransBigData also support adding rotation angle for the grids.you can also specify a rotation angle for the grids by adding the
theta into gridding params:[2]:
#Obtain the gridding parameters
params = tbd.area_to_params(bounds,accuracy = 1000)
#Add a rotation angle
params['theta'] = 5
print(params)
{'slon': 113.75, 'slat': 22.4, 'deltalon': 0.00974336289289822, 'deltalat': 0.008993210412845813, 'theta': 5, 'method': 'rect', 'gridsize': 1000}
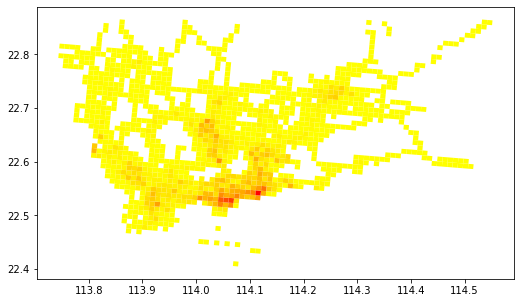
[3]:
#Map the GPS data to grids
data['LONCOL'],data['LATCOL'] = tbd.GPS_to_grid(data['lon'],data['lat'],params)
#Aggregate data into grids
grid_agg = data.groupby(['LONCOL','LATCOL'])['VehicleNum'].count().reset_index()
#Generate grid geometry
grid_agg['geometry'] = tbd.grid_to_polygon([grid_agg['LONCOL'],grid_agg['LATCOL']],params)
#Change the type into GeoDataFrame
import geopandas as gpd
grid_agg = gpd.GeoDataFrame(grid_agg)
#Plot the grids
grid_agg.plot(column = 'VehicleNum',cmap = 'autumn_r',figsize=(10,5))
[3]:
<AxesSubplot:>
Triangle and Hexagon grids
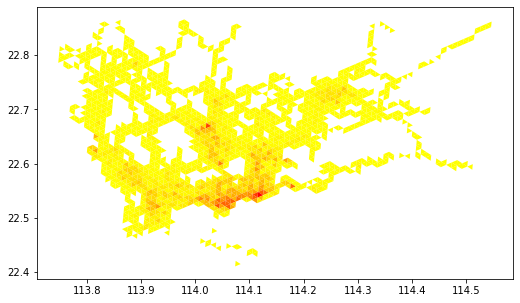
[4]:
#Triangle grids
params['method'] = 'tri'
[5]:
#Map the GPS data to grids
data['loncol_1'],data['loncol_2'],data['loncol_3'] = tbd.GPS_to_grid(data['lon'],data['lat'],params)
#Aggregate data into grids
grid_agg = data.groupby(['loncol_1','loncol_2','loncol_3'])['VehicleNum'].count().reset_index()
#Generate grid geometry
grid_agg['geometry'] = tbd.grid_to_polygon([grid_agg['loncol_1'],grid_agg['loncol_2'],grid_agg['loncol_3']],params)
#Change the type into GeoDataFrame
import geopandas as gpd
grid_agg = gpd.GeoDataFrame(grid_agg)
#Plot the grids
grid_agg.plot(column = 'VehicleNum',cmap = 'autumn_r',figsize=(10,5))
[5]:
<AxesSubplot:>
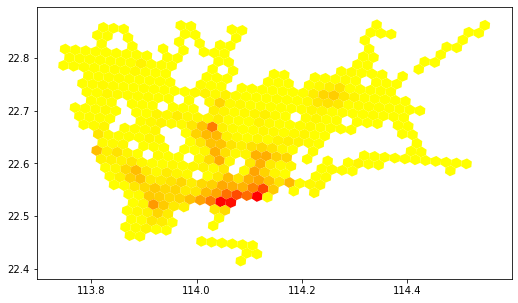
[6]:
#Hexagon grids
params['method'] = 'hexa'
[7]:
#Map the GPS data to grids
data['loncol_1'],data['loncol_2'],data['loncol_3'] = tbd.GPS_to_grid(data['lon'],data['lat'],params)
#Aggregate data into grids
grid_agg = data.groupby(['loncol_1','loncol_2','loncol_3'])['VehicleNum'].count().reset_index()
#Generate grid geometry
grid_agg['geometry'] = tbd.grid_to_polygon([grid_agg['loncol_1'],grid_agg['loncol_2'],grid_agg['loncol_3']],params)
#Change the type into GeoDataFrame
import geopandas as gpd
grid_agg = gpd.GeoDataFrame(grid_agg)
#Plot the grids
grid_agg.plot(column = 'VehicleNum',cmap = 'autumn_r',figsize=(10,5))
[7]:
<AxesSubplot:>