Trajectory Processing
|
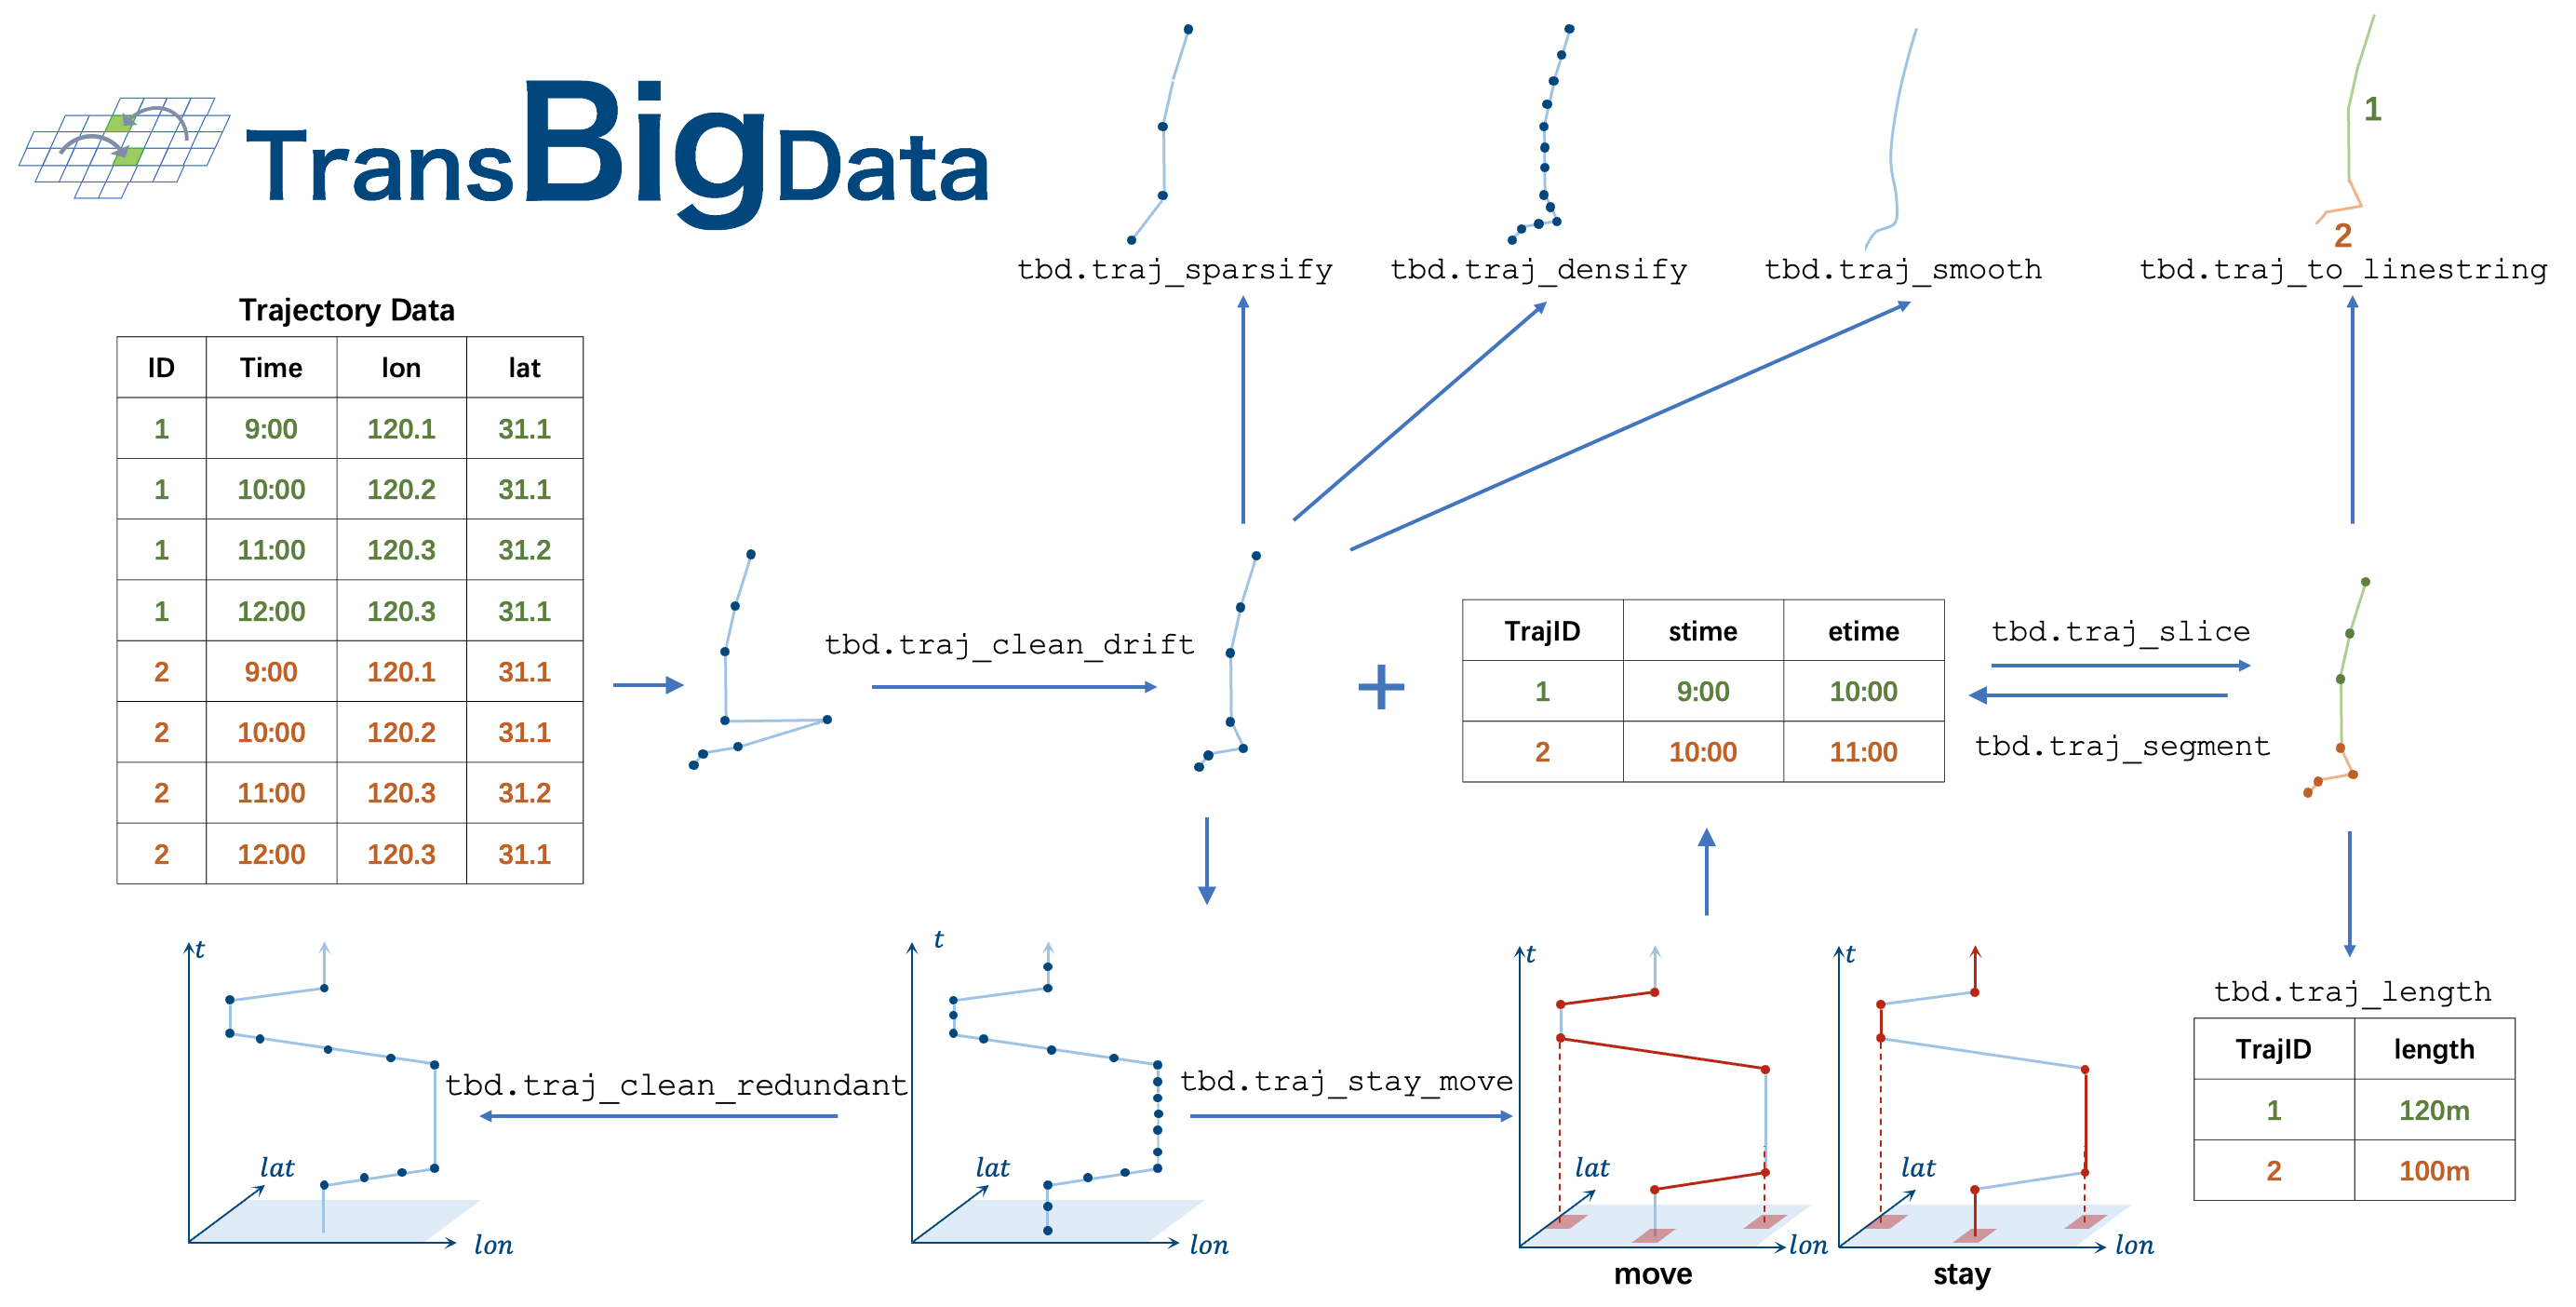
Delete the drift in the trajectory data. |
|
Delete the data with the same information as the data before and after to reduce the amount of data. |
|
Slice the trajectory data according to the slice data. |
|
Smooth Trajectory Using Kalman Filter. |
|
Segment the trajectory in order and return the starting and ending information of each segment. |
|
Trajectory densification, ensure that there is a trajectory point each timegap seconds |
|
Trajectory sparsify. |
|
Input trajectory data and gridding parameters, identify stay and move |
|
Input trajectory, generate GeoDataFrame |
|
Nearest map matching: Find the nearest point on the road network for each trajectory point. |
|
Calculate Trajectory Length. |
- transbigdata.traj_clean_drift(data, col=['VehicleNum', 'Time', 'Lng', 'Lat'], method='twoside', speedlimit=80, dislimit=1000, anglelimit=30)
Delete the drift in the trajectory data. The drift is defined as the data with a speed greater than the speed limit or the distance between the current point and the next point is greater than the distance limit or the angle between the current point, the previous point, and the next point is smaller than the angle limit. The speed limit is 80km/h by default, and the distance limit is 1000m by default. The method of cleaning drift data is divided into two methods: ‘oneside’ and ‘twoside’. The ‘oneside’ method is to consider the speed of the current point and the next point, and the ‘twoside’ method is to consider the speed of the current point, the previous point, and the next point.
- Parameters:
data (DataFrame) – Data
col (List) – Column names, in the order of [‘VehicleNum’, ‘Time’, ‘Lng’, ‘Lat’]
method (string) – Method of cleaning drift data, including ‘oneside’ and ‘twoside’
speedlimit (number) – Speed limitation
dislimit (number) – Distance limit
anglelimit (number) – Angle limit
- Returns:
data1 – Cleaned data
- Return type:
DataFrame
- transbigdata.traj_clean_redundant(data, col=['VehicleNum', 'Time', 'Lng', 'Lat'])
Delete the data with the same information as the data before and after to reduce the amount of data. For example, if several consecutive data of an individual have the same information except for the time, only the first and last two data can be kept
- Parameters:
data (DataFrame) – Data
col (List) – The column name, in the order of [‘Vehicleid, Time’]. It will sort by time, and then determine the information of other columns besides the time
- Returns:
data1 – Cleaned data
- Return type:
DataFrame
- transbigdata.traj_slice(traj_data, slice_data, traj_col=['vid', 'time'], slice_col=['vid', 'stime', 'etime', 'tripid'])
Slice the trajectory data according to the slice data. This method extracts data from a given set of trajectory data(traj_data) based on a specified time period(slice_data).
- Parameters:
traj_data (DataFrame) – Trajectory data, containing the trajectory of each vehicle
slice_data (DataFrame) – Slice data, containing the start time, end time and vehicleid of each slice
traj_col (List) – The column name of trajectory data, in the sequence of [VehicleNum, Time]
slice_col (List) – The column name of slice data, in the sequence of [VehicleNum_slice, Stime, Etime, SliceId]
- Returns:
data_sliced – The sliced trajectory data
- Return type:
DataFrame
Example
>>> tbd.traj_slice(GPSData, move, traj_col=['vid', 'time'], slice_col = ['vid','stime','etime','tripid'])
- transbigdata.traj_smooth(data, col=['id', 'time', 'lon', 'lat'], proj=False, process_noise_std=0.5, measurement_noise_std=1)
Smooth Trajectory Using Kalman Filter.
- Parameters:
data (DataFrame) – Trajectory data
col (list) – Column names of the trajectory data
proj (bool) – Whether to perform equidistant projection
process_noise_std (float) – Standard deviation of the process noise
measurement_noise_std (float) – Standard deviation of the measurement noise
- Returns:
data – Smoothed trajectory data
- Return type:
DataFrame
- transbigdata.traj_segment(data, groupby_col=['id', 'moveid'], retain_col=['time', 'lon', 'lat'])
Segment the trajectory in order and return the starting and ending information of each segment. This function can segment GPS trajectory data, calculate the start and end information of each segment, and store the results in a DataFrame object. The input of this function includes a pandas DataFrame object containing GPS trajectory data, field names for grouping, and field names to be retained. The output is a pandas DataFrame object containing the starting and ending information of each segment, where each row represents a trajectory segment.
- Parameters:
data (DataFrame) – The trajectory data needs to be sorted beforehand.
groupby_col (List) – A list of strings specifying the groupby fields to be used for segmentation.
retain_col (List) – A list of strings specifying the fields to be retained.
- Returns:
data – Containing the starting and ending information of each segment, where each row represents a trajectory segment.
- Return type:
DataFrame
- transbigdata.traj_densify(data, col=['Vehicleid', 'Time', 'Lng', 'Lat'], timegap=15)
Trajectory densification, ensure that there is a trajectory point each timegap seconds
- Parameters:
data (DataFrame) – Data
col (List) – The column name, in the sequence of [Vehicleid, Time, lng, lat]
timegap (number) – The sampling interval (second)
- Returns:
data1 – The processed data
- Return type:
DataFrame
- transbigdata.traj_sparsify(data, col=['Vehicleid', 'Time', 'Lng', 'Lat'], timegap=15, method='subsample')
Trajectory sparsify. When the sampling frequency of trajectory data is too high, the amount of data is too large, which is not convenient for the analysis of some studies that require less data frequency. This function can expand the sampling interval and reduce the amount of data.
- Parameters:
data (DataFrame) – Data
col (List) – The column name, in the sequence of [Vehicleid, Time, lng, lat]
timegap (number) – Time gap between trajectory point
method (str) – ‘interpolate’ or ‘subsample’
- Returns:
data1 – Sparsified trajectory data
- Return type:
DataFrame
- transbigdata.traj_stay_move(data, params, col=['ID', 'dataTime', 'longitude', 'latitude'], activitytime=1800)
Input trajectory data and gridding parameters, identify stay and move
- Parameters:
data (DataFrame) – trajectory data
params (List) – gridding parameters
col (List) – The column name, in the order of [‘ID’,’dataTime’,’longitude’, ‘latitude’]
activitytime (Number) – How much time to regard as activity
- Returns:
stay (DataFrame) – stay information
move (DataFrame) – move information
- transbigdata.traj_to_linestring(traj_points, col=['Lng', 'Lat', 'ID'], timecol=None)
Input trajectory, generate GeoDataFrame
- Parameters:
traj_points (DataFrame) – trajectory data
col (List) – The column name, in the sequence of [lng, lat,trajectoryid]
timecol (str(Optional)) – Optional, the column name of the time column. If given, the geojson with [longitude, latitude, altitude, time] in returns can be put into the Kepler to visualize the trajectory
- Returns:
traj – Generated trajectory
- Return type:
GeoDataFrame
- transbigdata.traj_mapmatch(traj, G, col=['lon', 'lat'])
Nearest map matching: Find the nearest point on the road network for each trajectory point. When conducting nearest neighbor matching, we need to find the closest road segment on the road network for each trajectory point, and match the trajectory point to that segment. In practice, we can first extract the nodes of the road segments to form a set of points (i.e., extracting each coordinate point from each LineString in the geometry column), then calculate the nearest distance between the trajectory point and this set of points, and finally match the trajectory point to the road segment where the nearest distance’s node is located. This process effectively transforms the problem of matching points to lines into a problem of matching points to points.
- Parameters:
traj (DataFrame) – The trajectory point data set to be matched.
G (networkx multidigraph) – The road network used for matching, created by osmnx.
col (list) – The name of the longitude and latitude columns in the trajectory point data set.
- Returns:
traj_matched – The trajectory point data set after matching.
- Return type:
DataFrame
- transbigdata.traj_length(move_points, col=['lon', 'lat', 'moveid'], method='Haversine')
Calculate Trajectory Length. Input the trajectory point data and calculate the length of each trajectory in meters.
- Parameters:
move_points (DataFrame) – Trajectory point data, which includes trajectory id, longitude, latitude, etc. Different trajectories are distinguished by trajectory id, and trajectory points are arranged in time order.
col (list) – Column names of the trajectory point data, in the order of [longitude, latitude, trajectory id]
method (str) – The method of calculating the trajectory length, optional ‘Haversine’ or ‘Project’, default is ‘Haversine’ using the haversine formula to calculate spherical distance, ‘Project’ transforms the data into a projected coordinate system to calculate plane distance.
- Returns:
move_trajs – Trajectory length data, including two columns of trajectory id and trajectory length, the unit is meters.
- Return type:
DataFrame