Data Gridding
|
Generate the rectangular grids in the bounds or shape |
|
Generate gridding params |
|
Match the GPS data to the grids. |
|
The center location of the grid. |
|
Generate the geometry column based on the grid ID. |
|
Input the two columns of grid ID, the geographic polygon and gridding paramters. |
|
Regenerate gridding params from grid. |
|
Optimize the grid params |
|
Input latitude and longitude and precision, and encode geohash code |
|
Decode geohash code |
|
Input geohash code to generate geohash grid cell |
Gridding Framework
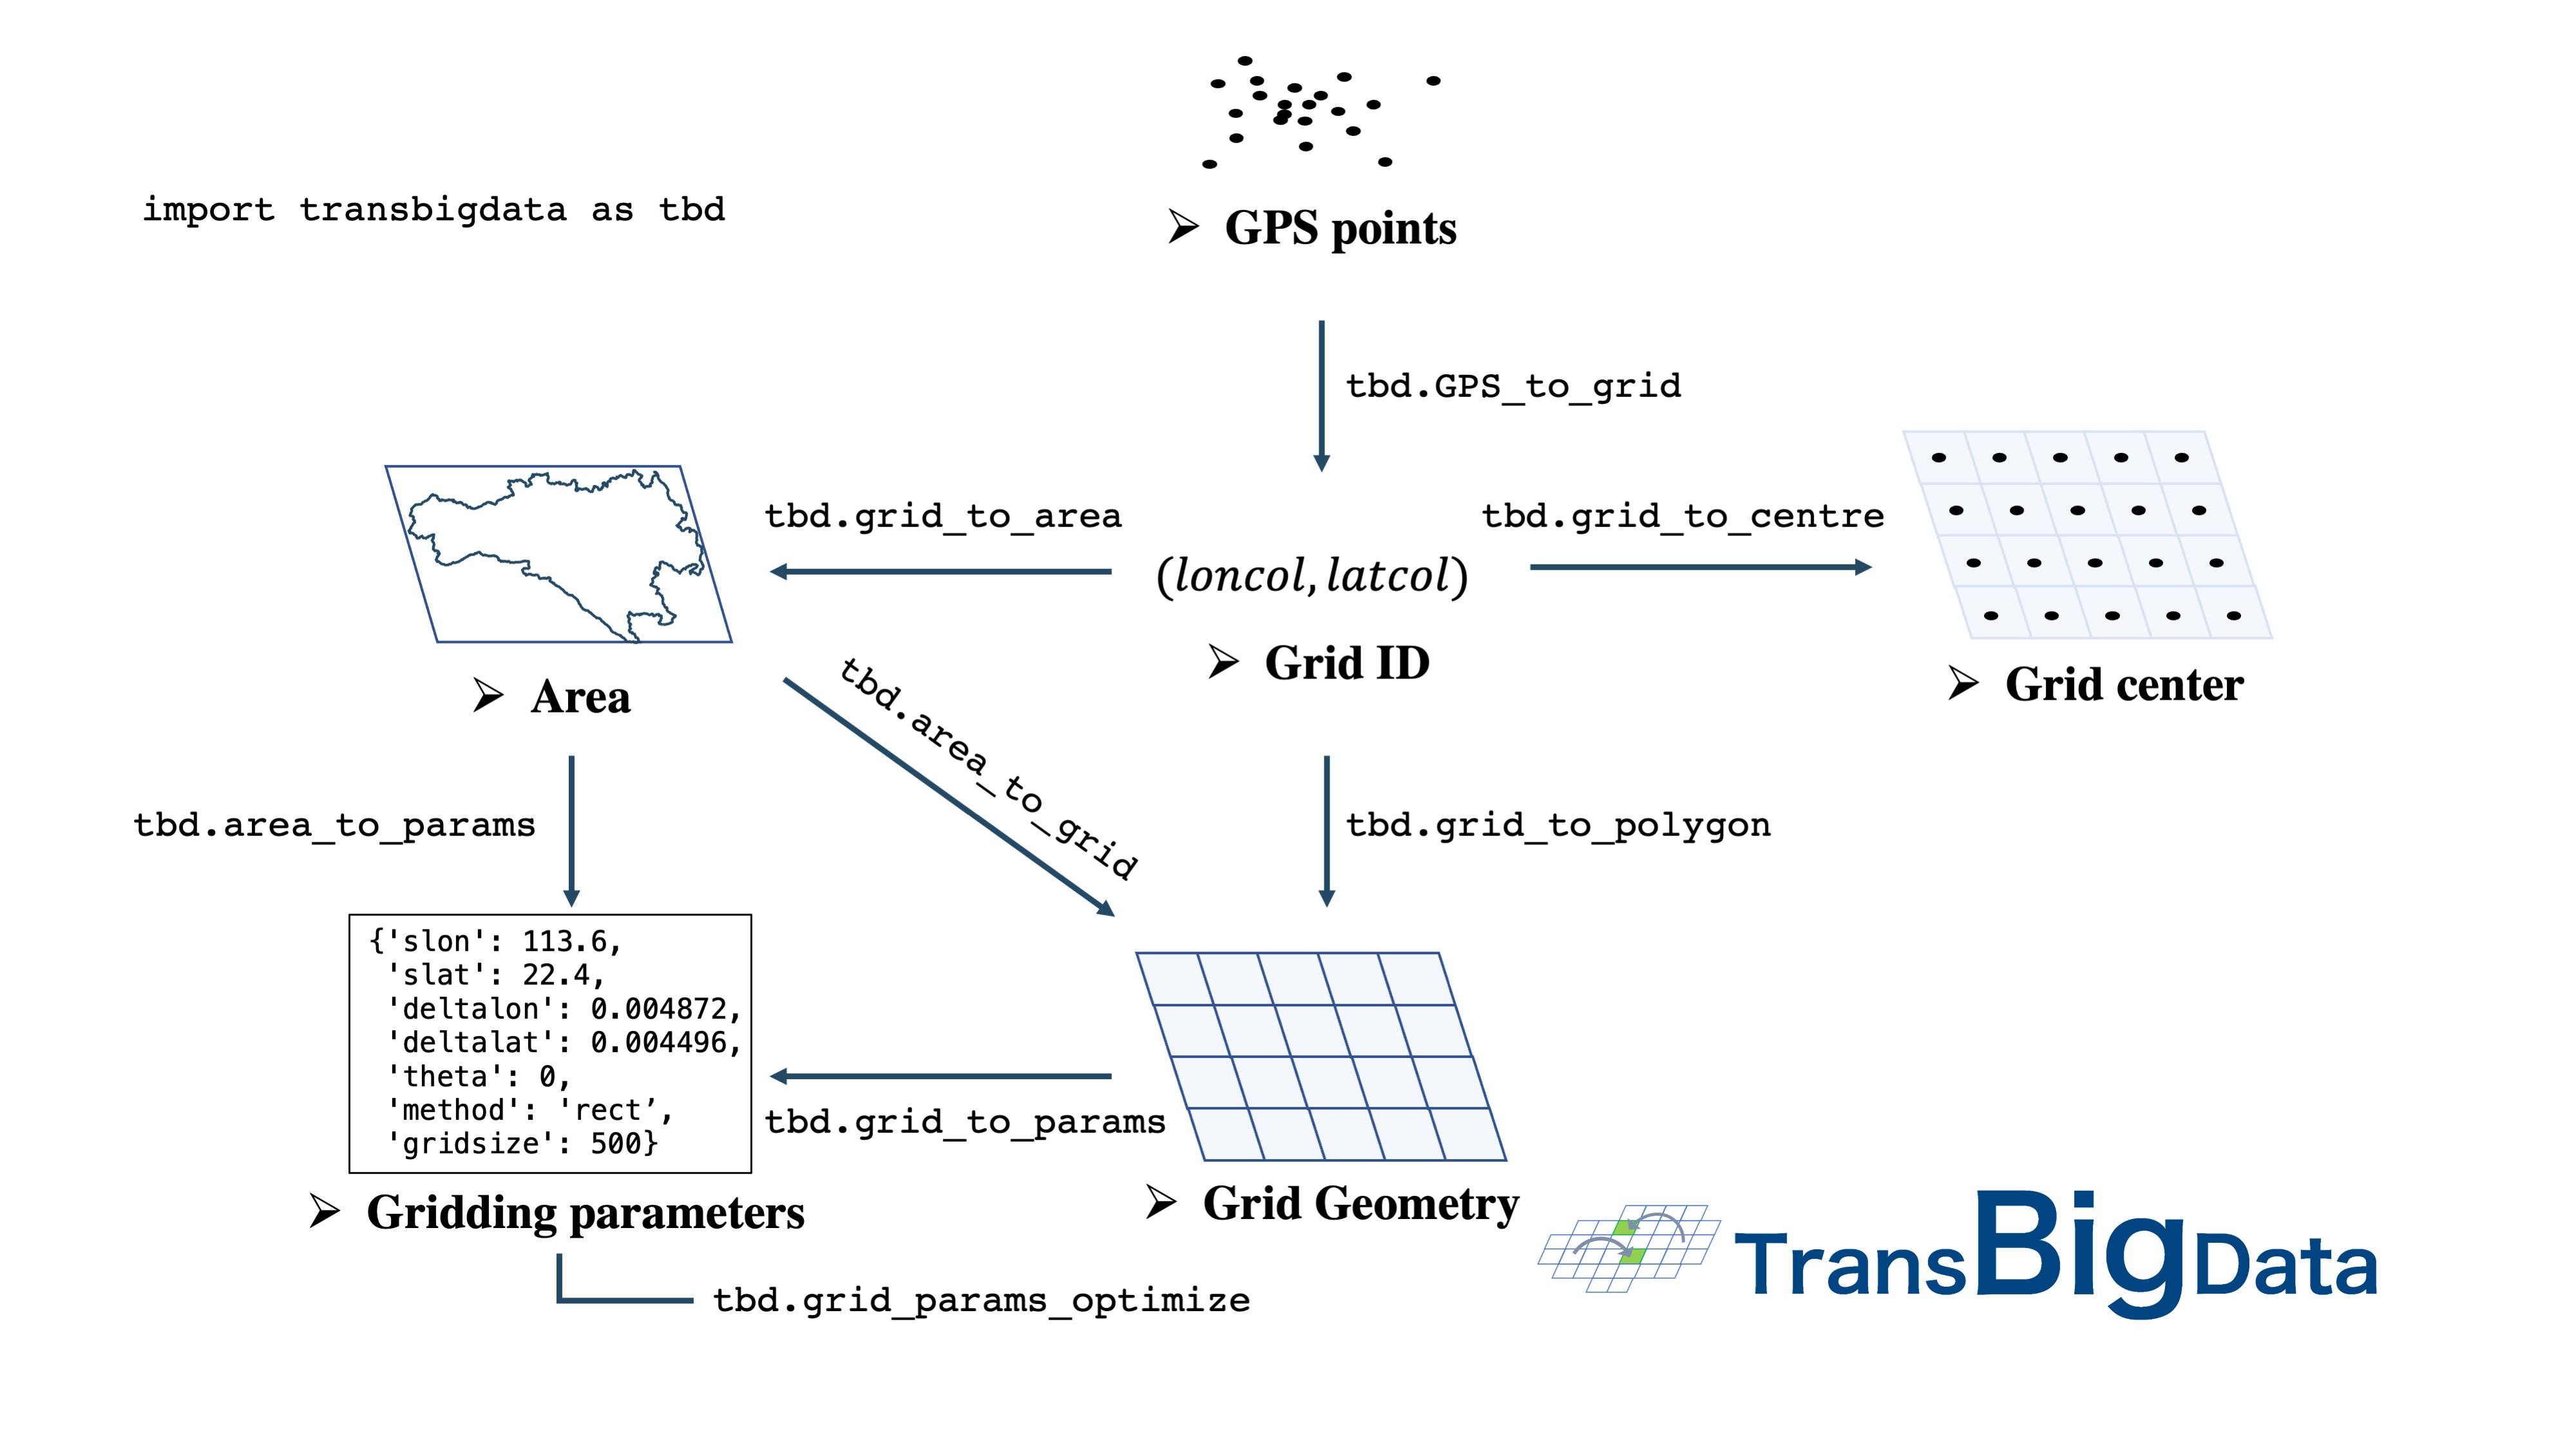
- transbigdata.area_to_grid(location, accuracy=500, method='rect', params='auto')
Generate the rectangular grids in the bounds or shape
- Parameters:
location (bounds(List) or shape(GeoDataFrame)) – Where to generate grids. If bounds, [lon1, lat1, lon2, lat2](WGS84), where lon1 , lat1 are the lower-left coordinates, lon2 , lat2 are the upper-right coordinates If shape, it should be GeoDataFrame
accuracy (number) – Grid size (meter)
method (str) – rect, tri or hexa
params (list or dict) – Gridding parameters. See https://transbigdata.readthedocs.io/en/latest/grids.html for detail information about gridding parameters. When Gridding parameters is given, accuracy will not be used.
- Returns:
grid (GeoDataFrame) – Grid GeoDataFrame, LONCOL and LATCOL are the index of grids, HBLON and HBLAT are the center of the grids
params (list or dict) – Gridding parameters. See https://transbigdata.readthedocs.io/en/latest/grids.html for detail information about gridding parameters.
- transbigdata.area_to_params(location, accuracy=500, method='rect')
Generate gridding params
- Parameters:
location (bounds(List) or shape(GeoDataFrame)) – Where to generate grids. If bounds, [lon1, lat1, lon2, lat2](WGS84), where lon1 , lat1 are the lower-left coordinates, lon2 , lat2 are the upper-right coordinates If shape, it should be GeoDataFrame
accuracy (number) – Grid size (meter)
method (str) – rect, tri or hexa
- Returns:
params – Gridding parameters. See https://transbigdata.readthedocs.io/en/latest/grids.html for detail information about gridding parameters.
- Return type:
list or dict
- transbigdata.GPS_to_grid(lon, lat, params)
Match the GPS data to the grids. The input is the columns of longitude, latitude, and the grids parameter. The output is the grid ID.
- Parameters:
lon (Series) – The column of longitude
lat (Series) – The column of latitude
params (list or dict) – Gridding parameters. See https://transbigdata.readthedocs.io/en/latest/grids.html for detail information about gridding parameters.
- Returns:
Rectangle grids
[LONCOL,LATCOL] (list) – The two columns LONCOL and LATCOL together can specify a grid.
Triangle and Hexagon grids
[loncol_1,loncol_2,loncol_3] (list) – The index of the grid latitude. The two columns LONCOL and LATCOL together can specify a grid.
- transbigdata.grid_to_centre(gridid, params)
The center location of the grid. The input is the grid ID and parameters, the output is the grid center location.
- Parameters:
gridid (list) –
if Rectangle grids [LONCOL,LATCOL] : Series
The two columns LONCOL and LATCOL together can specify a grid.
if Triangle and Hexagon grids [loncol_1,loncol_2,loncol_3] : Series
The index of the grid latitude. The two columns LONCOL and LATCOL together can specify a grid.
params (list or dict) – Gridding parameters. See https://transbigdata.readthedocs.io/en/latest/grids.html for detail information about gridding parameters.
- Returns:
HBLON (Series) – The longitude of the grid center
HBLAT (Series) – The latitude of the grid center
- transbigdata.grid_to_polygon(gridid, params)
Generate the geometry column based on the grid ID. The input is the grid ID, the output is the geometry. Support rectangle, triangle and hexagon grids
- Parameters:
gridid (list) –
if Rectangle grids [LONCOL,LATCOL] : Series
The two columns LONCOL and LATCOL together can specify a grid.
if Triangle and Hexagon grids [loncol_1,loncol_2,loncol_3] : Series
The index of the grid latitude. The two columns LONCOL and LATCOL together can specify a grid.
params (list or dict) – Gridding parameters. See https://transbigdata.readthedocs.io/en/latest/grids.html for detail information about gridding parameters.
- Returns:
geometry – The column of grid geographic polygon
- Return type:
Series
- transbigdata.grid_to_area(data, shape, params, col=['LONCOL', 'LATCOL'])
Input the two columns of grid ID, the geographic polygon and gridding paramters. The output is the grid.
- Parameters:
data (DataFrame) – Data, with two columns of grid ID
shape (GeoDataFrame) – Geographic polygon
params (list or dict) – Gridding parameters. See https://transbigdata.readthedocs.io/en/latest/grids.html for detail information about gridding parameters.
col (List) – Column names [LONCOL,LATCOL] for rect grids or [loncol_1,loncol_2,loncol_3] for tri and hexa grids
- Returns:
data1 – Data gridding and mapping to the corresponding geographic polygon
- Return type:
DataFrame
- transbigdata.grid_to_params(grid)
Regenerate gridding params from grid. Only support rect grids now.
- Parameters:
grid (GeoDataFrame) – grids generated by transbigdata
- Returns:
params – Gridding parameters. See https://transbigdata.readthedocs.io/en/latest/grids.html for detail information about gridding parameters.
- Return type:
list or dict
- transbigdata.grid_params_optimize(data, initialparams, col=['uid', 'lon', 'lat'], optmethod='centerdist', printlog=False, sample=0, pop=15, max_iter=50, w=0.1, c1=0.5, c2=0.5)
Optimize the grid params
- Parameters:
data (DataFrame) – Trajectory data
initialparams (List) – Initial griding params
col (List) – Column names [uid,lon,lat]
optmethod (str) – The method to optimize: centerdist, gini, gridscount
printlog (bool) – Whether to print detail result
sample (int) – Sample the data as input, if 0 it will not perform sampling
pop – Params in PSO from scikit-opt
max_iter – Params in PSO from scikit-opt
w – Params in PSO from scikit-opt
c1 – Params in PSO from scikit-opt
c2 – Params in PSO from scikit-opt
- Returns:
params_optimized – Optimized params
- Return type:
List
geohash encoding
Geohash is a public geocoding system that encodes latitude and longitude geographic locations into strings of letters and numbers, which can also be decoded back to latitude and longitude. Each string represents a grid number, and the longer the length of the string, the higher the precision. According to wiki <https://en.wikipedia.org/wiki/Geohash>, the table of Geohash string lengths corresponding to precision is as follows.
geohash length(precision) |
lat bits |
lng bits |
lat error |
lng error |
km error |
|---|---|---|---|---|---|
1 |
2 |
3 |
±23 |
±23 |
±2500 |
2 |
5 |
5 |
±2.8 |
±5.6 |
±630 |
3 |
7 |
8 |
±0.70 |
±0.70 |
±78 |
4 |
10 |
10 |
±0.087 |
±0.18 |
±20 |
5 |
12 |
13 |
±0.022 |
±0.022 |
±2.4 |
6 |
15 |
15 |
±0.0027 |
±0.0055 |
±0.61 |
7 |
17 |
18 |
±0.00068 |
±0.00068 |
±0.076 |
8 |
20 |
20 |
±0.000085 |
±0.00017 |
±0.019 |
TransBigData also provides the function based on Geohash, the three functions are as follows:
- transbigdata.geohash_encode(lon, lat, precision=12)
Input latitude and longitude and precision, and encode geohash code
- Parameters:
lon (Series) – longitude Series
lat (Series) – latitude Series
precision (number) – geohash precision
- Returns:
geohash – encoded geohash Series
- Return type:
Series
- transbigdata.geohash_decode(geohash)
Decode geohash code
- Parameters:
geohash (Series) – encoded geohash Series
- Returns:
lon (Series) – decoded longitude Series
lat (Series) – decoded latitude Series
- transbigdata.geohash_togrid(geohash)
Input geohash code to generate geohash grid cell
- Parameters:
geohash (Series) – encoded geohash Series
- Returns:
poly – grid cell polygon for geohash
- Return type:
Series
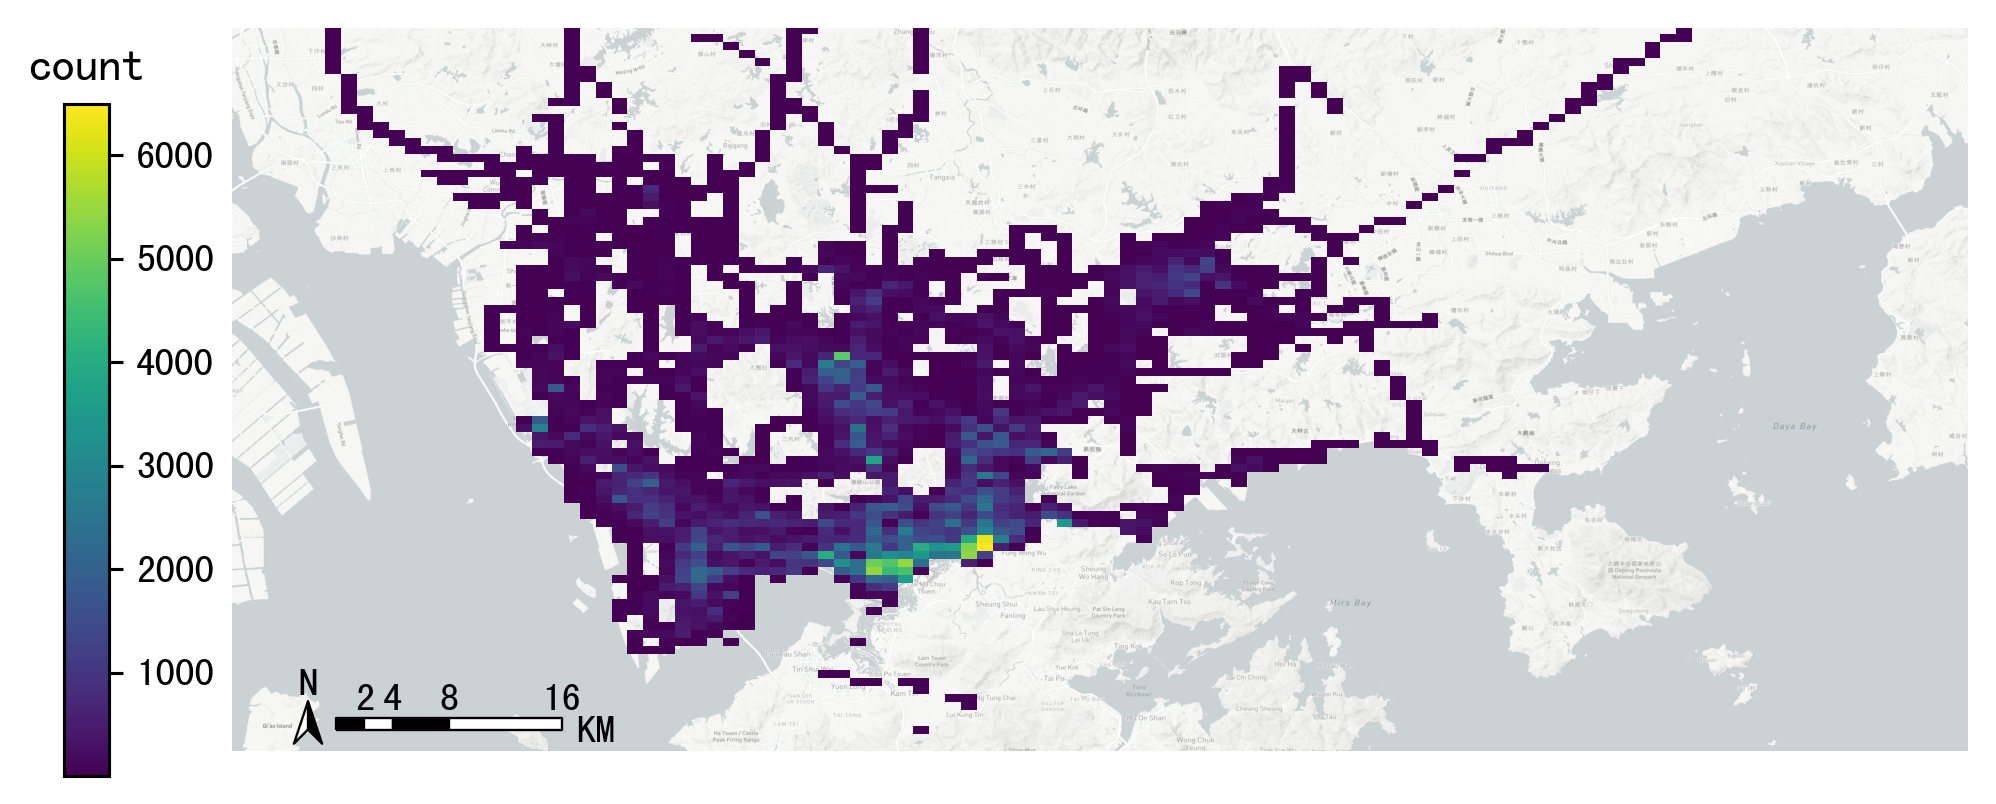
Compared to the rectangular grid processing method provided in the TransBigData package, geohash is slower and does not provide a freely defined grid size. The following example shows how to use these three functions to utilize the geohash encoding, decoding, and the visualization
import transbigdata as tbd
import pandas as pd
import geopandas as gpd
#read data
data = pd.read_csv('TaxiData-Sample.csv',header = None)
data.columns = ['VehicleNum','time','slon','slat','OpenStatus','Speed']
#encode geohash
data['geohash'] = tbd.geohash_encode(data['slon'],data['slat'],precision=6)
data['geohash']
0         ws0btw
1         ws0btz
2         ws0btz
3         ws0btz
4         ws0by4
           ...
544994    ws131q
544995    ws1313
544996    ws131f
544997    ws1361
544998    ws10tq
Name: geohash, Length: 544999, dtype: object
#Aggregate
dataagg = data.groupby(['geohash'])['VehicleNum'].count().reset_index()
dataagg['lon_geohash'],dataagg['lat_geohash'] = tbd.geohash_decode(dataagg['geohash'])
dataagg['geometry'] = tbd.geohash_togrid(dataagg['geohash'])
dataagg = gpd.GeoDataFrame(dataagg)
dataagg
| geohash | VehicleNum | lon_geohash | lat_geohash | geometry | |
|---|---|---|---|---|---|
| 0 | w3uf3x | 1 | 108. | 10.28 | POLYGON ((107.99561 10.27771, 107.99561 10.283... |
| 1 | webzz6 | 12 | 113.9 | 22.47 | POLYGON ((113.87329 22.46704, 113.87329 22.472... |
| 2 | webzz7 | 21 | 113.9 | 22.48 | POLYGON ((113.87329 22.47253, 113.87329 22.478... |
| 3 | webzzd | 1 | 113.9 | 22.47 | POLYGON ((113.88428 22.46704, 113.88428 22.472... |
| 4 | webzzf | 2 | 113.9 | 22.47 | POLYGON ((113.89526 22.46704, 113.89526 22.472... |
| ... | ... | ... | ... | ... | ... |
| 2022 | ws1d9u | 1 | 114.7 | 22.96 | POLYGON ((114.68628 22.96143, 114.68628 22.966... |
| 2023 | ws1ddh | 6 | 114.7 | 22.96 | POLYGON ((114.69727 22.96143, 114.69727 22.966... |
| 2024 | ws1ddj | 2 | 114.7 | 22.97 | POLYGON ((114.69727 22.96692, 114.69727 22.972... |
| 2025 | ws1ddm | 4 | 114.7 | 22.97 | POLYGON ((114.70825 22.96692, 114.70825 22.972... |
| 2026 | ws1ddq | 7 | 114.7 | 22.98 | POLYGON ((114.70825 22.97241, 114.70825 22.977... |
2027 rows × 5 columns
bounds = [113.6,22.4,114.8,22.9]
import matplotlib.pyplot as plt
import plot_map
fig =plt.figure(1,(8,8),dpi=280)
ax =plt.subplot(111)
plt.sca(ax)
tbd.plot_map(plt,bounds,zoom = 12,style = 4)
cax = plt.axes([0.05, 0.33, 0.02, 0.3])
plt.title('count')
plt.sca(ax)
dataagg.plot(ax = ax,column = 'VehicleNum',cax = cax,legend = True)
tbd.plotscale(ax,bounds = bounds,textsize = 10,compasssize = 1,accuracy = 2000,rect = [0.06,0.03],zorder = 10)
plt.axis('off')
plt.xlim(bounds[0],bounds[2])
plt.ylim(bounds[1],bounds[3])
plt.show()