Activity
|
Plot the activity plot of individual |
|
Calculate entropy. |
|
Calculate entropy rate. |
|
confidence ellipse parameter estimation for point data |
|
Enter the parameters of the confidence ellipse and plot the confidence ellipse |
Activity plot
- transbigdata.plot_activity(data, col=['stime', 'etime', 'group'], figsize=(10, 5), dpi=250, shuffle=True, xticks_rotation=0, xticks_gap=1, yticks_gap=1, fontsize=12)
Plot the activity plot of individual
- Parameters:
data (DataFrame) – activity information of one person
col (List) – The column name. [starttime,endtime,group] of activities, group control the color
figsize (List) – The figure size
dpi (Number) – The dpi of the figure
shuffle (bool) – Whether to shuffle the activity
xticks_rotation (Number) – rotation angle of xticks
xticks_gap (Number) – gap of xticks
yticks_gap (Number) – gap of yticks
fontsize (Number) – font size of xticks and yticks
Entropy
- transbigdata.entropy(sequence)
Calculate entropy.
- Parameters:
sequence (List,DataFrame,Series) – sequence data
- Returns:
entropy
- Return type:
Number
- transbigdata.entropy_rate(sequence)
Calculate entropy rate. Reference: Goulet-Langlois, G., Koutsopoulos, H. N., Zhao, Z., & Zhao, J. (2017). Measuring regularity of individual travel patterns. IEEE Transactions on Intelligent Transportation Systems, 19(5), 1583-1592.
- Parameters:
sequence (List,DataFrame,Series) – sequence data
- Returns:
entropy_rate
- Return type:
Number
Confidence ellipse
- transbigdata.ellipse_params(data, col=['lon', 'lat'], confidence=95, epsg=None)
confidence ellipse parameter estimation for point data
- Parameters:
data (DataFrame) – point data
confidence (number) – confidence level: 99,95 or 90
epsg (number) – If given, the original coordinates are transformed from WGS84 to the given EPSG coordinate system for confidence ellipse parameter estimation
col (List) – Column names, [lon,lat]
- Returns:
params – Centroid ellipse parameters[pos,width,height,theta,area,oblateness] Respectively [Center point coordinates, minor axis, major axis, angle, area, oblateness]
- Return type:
List
- transbigdata.ellipse_plot(ellip_params, ax, **kwargs)
Enter the parameters of the confidence ellipse and plot the confidence ellipse
- Parameters:
ellip_params (List) – Centroid ellipse parameters[pos,width,height,theta,area,oblateness] Respectively[Center point coordinates, minor axis, major axis, angle , area, oblateness]
ax (matplotlib.axes._subplots.AxesSubplot) – Where to plot
用法
import pandas as pd
import transbigdata as tbd
import numpy as np
#生成测试用数据
data = np.random.uniform(1,10,(100,2))
data[:,1:] = 0.5*data[:,0:1]+np.random.uniform(-2,2,(100,1))
data = pd.DataFrame(data,columns = ['x','y'])
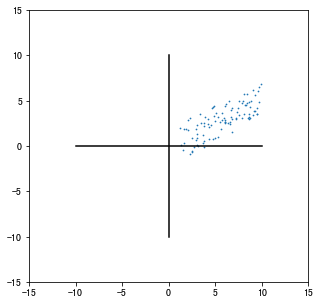
#绘制数据分布
import matplotlib.pyplot as plt
plt.figure(1,(5,5))
#绘制数据点
plt.scatter(data['x'],data['y'],s = 0.5)
#绘制坐标轴
plt.plot([-10,10],[0,0],c = 'k')
plt.plot([0,0],[-10,10],c = 'k')
plt.xlim(-15,15)
plt.ylim(-15,15)
plt.show()
输入数据与xy坐标所在列名,置信度,估计椭圆参数 分别代表[中心点坐标,短轴,长轴,角度,面积,扁率
ellip_params = tbd.ellipse_params(data,confidence=95,col = ['x','y'])
ellip_params
[array([5.78928146, 2.88466235]),
 4.6981983145616875,
 14.04315715927693,
 -58.15524535916836,
 51.8186366184246,
 0.6654457212665993]
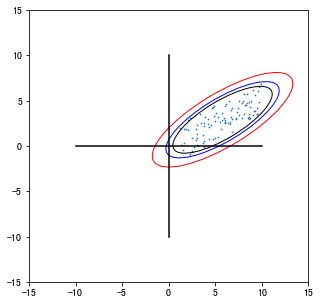
再用tbd.ellipse_plot绘制置信椭圆
#绘制数据分布
import matplotlib.pyplot as plt
plt.figure(1,(5,5))
ax = plt.subplot(111)
#绘制数据点
plt.scatter(data['x'],data['y'],s = 0.5)
#获取置信椭圆参数并绘制椭圆
#99%置信椭圆
ellip_params = tbd.ellipse_params(data,confidence=99,col = ['x','y'])
tbd.ellipse_plot(ellip_params,ax,fill = False,edgecolor = 'r',linewidth = 1)
#95%置信椭圆
ellip_params = tbd.ellipse_params(data,confidence=95,col = ['x','y'])
tbd.ellipse_plot(ellip_params,ax,fill = False,edgecolor = 'b',linewidth = 1)
#90%置信椭圆
ellip_params = tbd.ellipse_params(data,confidence=90,col = ['x','y'])
tbd.ellipse_plot(ellip_params,ax,fill = False,edgecolor = 'k',linewidth = 1)
#绘制坐标轴
plt.plot([-10,10],[0,0],c = 'k')
plt.plot([0,0],[-10,10],c = 'k')
plt.xlim(-15,15)
plt.ylim(-15,15)
plt.show()