Data Visualization
|
The input is the data points, this function will aggregate and then visualize it |
|
The input is the trajectory data and the column name. |
|
The input is the OD data and the column. |
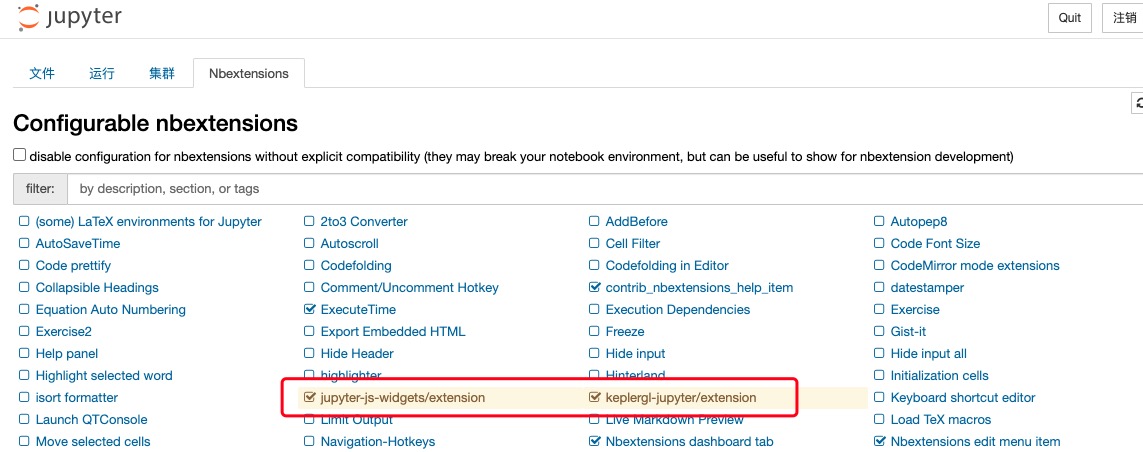
Visualization Settings in Jupyter
pip install keplergl
If you want to display the visualization results in jupyter notebook, you need to check the jupyter-js-widgets (which may need to be installed separately) and keplergl-jupyter plugins
Visualization of data point distribution
- transbigdata.visualization_data(data, col=['lon', 'lat'], accuracy=500, height=500, maptype='point', zoom='auto')
The input is the data points, this function will aggregate and then visualize it
- Parameters:
data (DataFrame) – The data point
col (List) – The column name. The user can choose a non-weight Origin-Destination (OD) data, in the sequence of [longitude, latitude]. For this, The aggregation is automatic. Or, the user can also input a weighted OD data, in the sequence of [longitude, latitude, count]
zoom (number) – Map zoom level (Optional). Default value: auto
height (number) – The height of the map frame
accuracy (number) – Grid size
maptype (str) – Map type, ‘point’ or ‘heatmap’
- Returns:
vmap – Visualizations provided by keplergl
- Return type:
keplergl.keplergl.KeplerGl
Trajectory Visualization
- transbigdata.visualization_trip(trajdata, col=['Lng', 'Lat', 'ID', 'Time'], zoom='auto', height=500)
The input is the trajectory data and the column name. The output is the visualization result based on kepler
- Parameters:
trajdata (DataFrame) – Trajectory points data
col (List) – The column name, in the sequence of [longitude, latitude, vehicle id, time]
zoom (number) – Map zoom level
height (number) – The height of the map frame
- Returns:
vmap – Visualizations provided by keplergl
- Return type:
keplergl.keplergl.KeplerGl
OD Visualization
- transbigdata.visualization_od(oddata, col=['slon', 'slat', 'elon', 'elat'], zoom='auto', height=500, accuracy=500, mincount=0)
The input is the OD data and the column. The output is the visualization result based on kepler
- Parameters:
oddata (DataFrame) – OD data
col (List) – The column name. The user can choose a non-weight Origin-Destination (OD) data, in the sequence of [origin longitude, origin latitude, destination longitude, destination latitude]. For this, The aggregation is automatic. Or, the user can also input a weighted OD data, in the sequence of [origin longitude, origin latitude, destination longitude, destination latitude, count]
zoom (number) – Map zoom level (Optional). Default value: auto
height (number) – The height of the map frame
accuracy (number) – Grid size
mincount (number) – The minimum OD counts, OD with less counts will not be displayed
- Returns:
vmap – Visualizations provided by keplergl
- Return type:
keplergl.keplergl.KeplerGl