9 Identifying arrival and departure information from Bus GPS data
To run this example, you may have to install seaborn:
pip install seaborn
The following example shows how to use TransBigData to process bus GPS data, including identifying bus arrival and departure information, calculate travel time and operating speed for buses.
[1]:
import warnings
warnings.filterwarnings('ignore')
[2]:
import transbigdata as tbd
import pandas as pd
import geopandas as gpd
Read data
Read bus GPS data
[3]:
BUS_GPS= pd.read_csv(r'data/busgps.csv',header = None)
BUS_GPS.columns = ['GPSDateTime', 'LineId', 'LineName', 'NextLevel', 'PrevLevel',
       'Strlatlon', 'ToDir', 'VehicleId', 'VehicleNo', 'unknow']
#Convert the time column to datetime type
BUS_GPS['GPSDateTime'] = pd.to_datetime(BUS_GPS['GPSDateTime'])
Convert coordinates
[4]:
#Slice the latitude and longitude string
BUS_GPS['lon'] = BUS_GPS['Strlatlon'].apply(lambda r:r.split(',')[0])
BUS_GPS['lat'] = BUS_GPS['Strlatlon'].apply(lambda r:r.split(',')[1])
#Convert coordinates
BUS_GPS['lon'],BUS_GPS['lat'] = tbd.gcj02towgs84(BUS_GPS['lon'].astype(float),BUS_GPS['lat'].astype(float))
BUS_GPS.head(5)
[4]:
| GPSDateTime | LineId | LineName | NextLevel | PrevLevel | Strlatlon | ToDir | VehicleId | VehicleNo | unknow | lon | lat | |
|---|---|---|---|---|---|---|---|---|---|---|---|---|
| 0 | 2019-01-16 23:59:59 | 7100 | 71 | 2 | 1 | 121.335413,31.173188 | 1 | 沪D-R7103 | Z5A-0021 | 1 | 121.330858 | 31.175129 |
| 1 | 2019-01-17 00:00:00 | 7100 | 71 | 2 | 1 | 121.334616,31.172271 | 1 | 沪D-R1273 | Z5A-0002 | 1 | 121.330063 | 31.174214 |
| 2 | 2019-01-17 00:00:00 | 7100 | 71 | 24 | 23 | 121.339955,31.173025 | 0 | 沪D-R5257 | Z5A-0020 | 1 | 121.335390 | 31.174958 |
| 3 | 2019-01-17 00:00:01 | 7100 | 71 | 14 | 13 | 121.409491,31.20433 | 0 | 沪D-R5192 | Z5A-0013 | 1 | 121.404843 | 31.206179 |
| 4 | 2019-01-17 00:00:03 | 7100 | 71 | 15 | 14 | 121.398615,31.200253 | 0 | 沪D-T0951 | Z5A-0022 | 1 | 121.393966 | 31.202103 |
Read the bus line data
[5]:
shp = r'data/busline.json'
linegdf = gpd.GeoDataFrame.from_file(shp,encoding = 'gbk')
line = linegdf.iloc[:1].copy()
line.plot()
[5]:
<AxesSubplot:>
Read the bus stop data
[6]:
shp = r'data/busstop.json'
stop = gpd.GeoDataFrame.from_file(shp,encoding = 'gbk')
stop = stop[stop['linename'] == '71路(延安东路外滩-申昆路枢纽站)']
stop.plot()
[6]:
<AxesSubplot:>
Identifying arrival and departure information
[7]:
arriveinfo = tbd.busgps_arriveinfo(BUS_GPS,line,stop)
Cleaning data...
Position matching......
Matching arrival and leaving info.........................................................................................................................................................
[8]:
arriveinfo
[8]:
| arrivetime | leavetime | stopname | VehicleId | |
|---|---|---|---|---|
| 0 | 2019-01-17 07:19:42 | 2019-01-17 07:31:14 | 延安东路外滩 | 1 |
| 1 | 2019-01-17 09:53:08 | 2019-01-17 10:09:34 | 延安东路外滩 | 1 |
| 0 | 2019-01-17 07:13:23 | 2019-01-17 07:15:45 | 西藏中路 | 1 |
| 1 | 2019-01-17 07:34:24 | 2019-01-17 07:35:38 | 西藏中路 | 1 |
| 2 | 2019-01-17 09:47:03 | 2019-01-17 09:50:22 | 西藏中路 | 1 |
| ... | ... | ... | ... | ... |
| 2 | 2019-01-17 16:35:52 | 2019-01-17 16:36:49 | 吴宝路 | 148 |
| 3 | 2019-01-17 19:21:09 | 2019-01-17 19:23:44 | 吴宝路 | 148 |
| 0 | 2019-01-17 13:36:26 | 2019-01-17 13:45:04 | 申昆路枢纽站 | 148 |
| 1 | 2019-01-17 15:52:26 | 2019-01-17 16:32:46 | 申昆路枢纽站 | 148 |
| 2 | 2019-01-17 19:24:54 | 2019-01-17 19:25:55 | 申昆路枢纽站 | 148 |
8984 rows × 4 columns
One-way travel time
Calculate the One-way travel time from arriveinfo obtained above. Given start and end stop name of the bus line, tbd.busgps_onewaytime can calculate the travel time between the two station.
[9]:
onewaytime = tbd.busgps_onewaytime(arriveinfo,
                                   start = '延安东路外滩',
                                   end = '申昆路枢纽站',col = ['VehicleId','stopname', 'arrivetime', 'leavetime'])
[10]:
onewaytime
[10]:
| time | stopname | VehicleId | time1 | stopname1 | VehicleId1 | duration | shour | direction | |
|---|---|---|---|---|---|---|---|---|---|
| 0 | 2019-01-17 07:31:14 | 延安东路外滩 | 1 | 2019-01-17 08:24:42 | 申昆路枢纽站 | 1.0 | 3208.0 | 7 | 延安东路外滩-申昆路枢纽站 |
| 1 | 2019-01-17 10:09:34 | 延安东路外滩 | 1 | 2019-01-17 11:03:49 | 申昆路枢纽站 | 1.0 | 3255.0 | 10 | 延安东路外滩-申昆路枢纽站 |
| 0 | 2019-01-17 13:11:43 | 延安东路外滩 | 2 | 2019-01-17 14:05:17 | 申昆路枢纽站 | 2.0 | 3214.0 | 13 | 延安东路外滩-申昆路枢纽站 |
| 1 | 2019-01-17 15:42:28 | 延安东路外滩 | 2 | 2019-01-17 16:37:00 | 申昆路枢纽站 | 2.0 | 3272.0 | 15 | 延安东路外滩-申昆路枢纽站 |
| 0 | 2019-01-17 18:46:11 | 延安东路外滩 | 3 | 2019-01-17 19:51:54 | 申昆路枢纽站 | 3.0 | 3943.0 | 18 | 延安东路外滩-申昆路枢纽站 |
| ... | ... | ... | ... | ... | ... | ... | ... | ... | ... |
| 1 | 2019-01-17 17:11:43 | 申昆路枢纽站 | 144 | 2019-01-17 18:13:22 | 延安东路外滩 | 144.0 | 3699.0 | 17 | 申昆路枢纽站-延安东路外滩 |
| 0 | 2019-01-17 08:15:44 | 申昆路枢纽站 | 147 | 2019-01-17 09:14:46 | 延安东路外滩 | 147.0 | 3542.0 | 8 | 申昆路枢纽站-延安东路外滩 |
| 1 | 2019-01-17 10:51:34 | 申昆路枢纽站 | 147 | 2019-01-17 11:50:03 | 延安东路外滩 | 147.0 | 3509.0 | 10 | 申昆路枢纽站-延安东路外滩 |
| 0 | 2019-01-17 13:45:04 | 申昆路枢纽站 | 148 | 2019-01-17 14:44:03 | 延安东路外滩 | 148.0 | 3539.0 | 13 | 申昆路枢纽站-延安东路外滩 |
| 1 | 2019-01-17 16:32:46 | 申昆路枢纽站 | 148 | 2019-01-17 17:31:34 | 延安东路外滩 | 148.0 | 3528.0 | 16 | 申昆路枢纽站-延安东路外滩 |
375 rows × 9 columns
For English display of the figures, here we will change the station name and direction name into English:
[11]:
onewaytime.loc[onewaytime['stopname']=='延安东路外滩','stopname']="Yanan road station"
onewaytime.loc[onewaytime['stopname1']=='申昆路枢纽站','stopname1']="Shenkun station"
onewaytime.loc[onewaytime['direction']=='延安东路外滩-申昆路枢纽站','direction']="Yanan road-Shenkun"
onewaytime.loc[onewaytime['direction']=='申昆路枢纽站-延安东路外滩','direction']="Shenkun-Yanan road"
[12]:
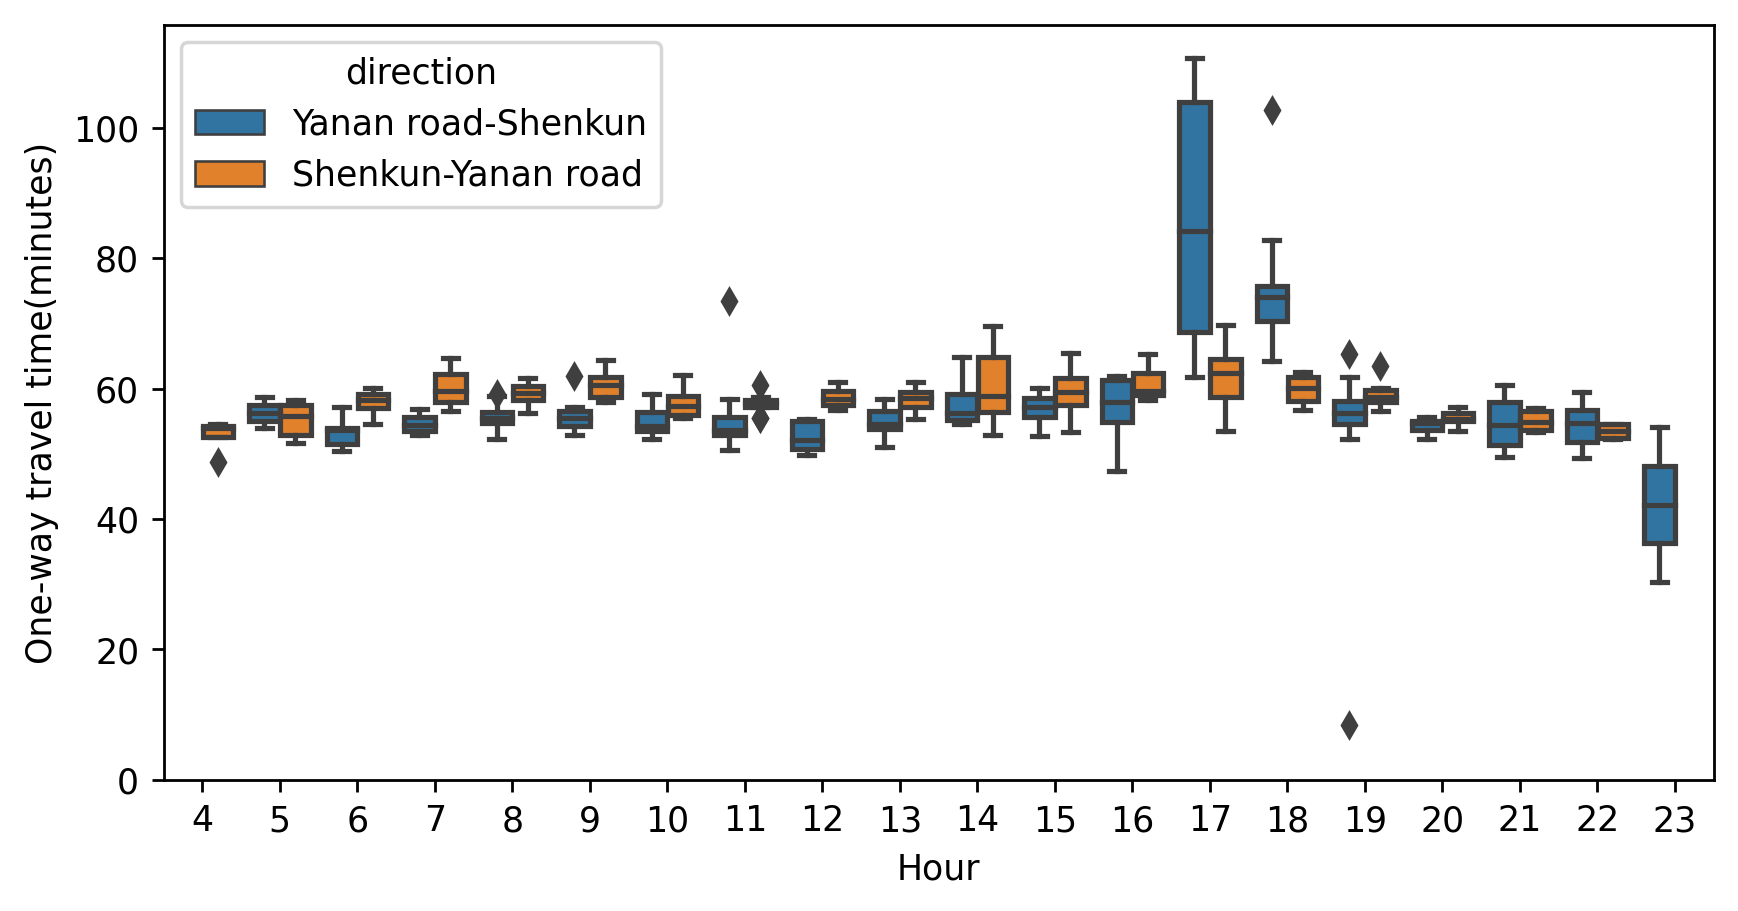
## Draw box plot for one-way travel time
import numpy as np
import matplotlib.pyplot as plt
import seaborn as sns
fig     = plt.figure(1,(8,4),dpi = 250)
ax1      = plt.subplot(111)

sns.boxplot(x = 'shour',y = onewaytime['duration']/60,hue = 'direction',data = onewaytime)

plt.ylabel('One-way travel time(minutes)')
plt.xlabel('Hour')
plt.ylim(0)
plt.show()
Travel speed of the buses
[13]:
#Convert coordinate system to projection coordinate system for later calculation of distance
line.crs = {'init':'epsg:4326'}
line_2416 = line.to_crs(epsg = 2416)
#Obtain the geometry inside the bus route data
lineshp = line_2416['geometry'].iloc[0]
linename = line_2416['name'].iloc[0]
lineshp
[13]:

[14]:
#Remove the data with abnormal speed
#Vehicle speed units converted to km/h
onewaytime['speed'] = (lineshp.length/onewaytime['duration'])*3.6
onewaytime = onewaytime[onewaytime['speed']<=60]
[15]:
## Travel speed distribution
import numpy as np
import matplotlib.pyplot as plt
import seaborn as sns
plt.rcParams['font.sans-serif']=['SimHei']
plt.rcParams['font.serif'] = ['SimHei']
plt.rcParams['axes.unicode_minus']=False
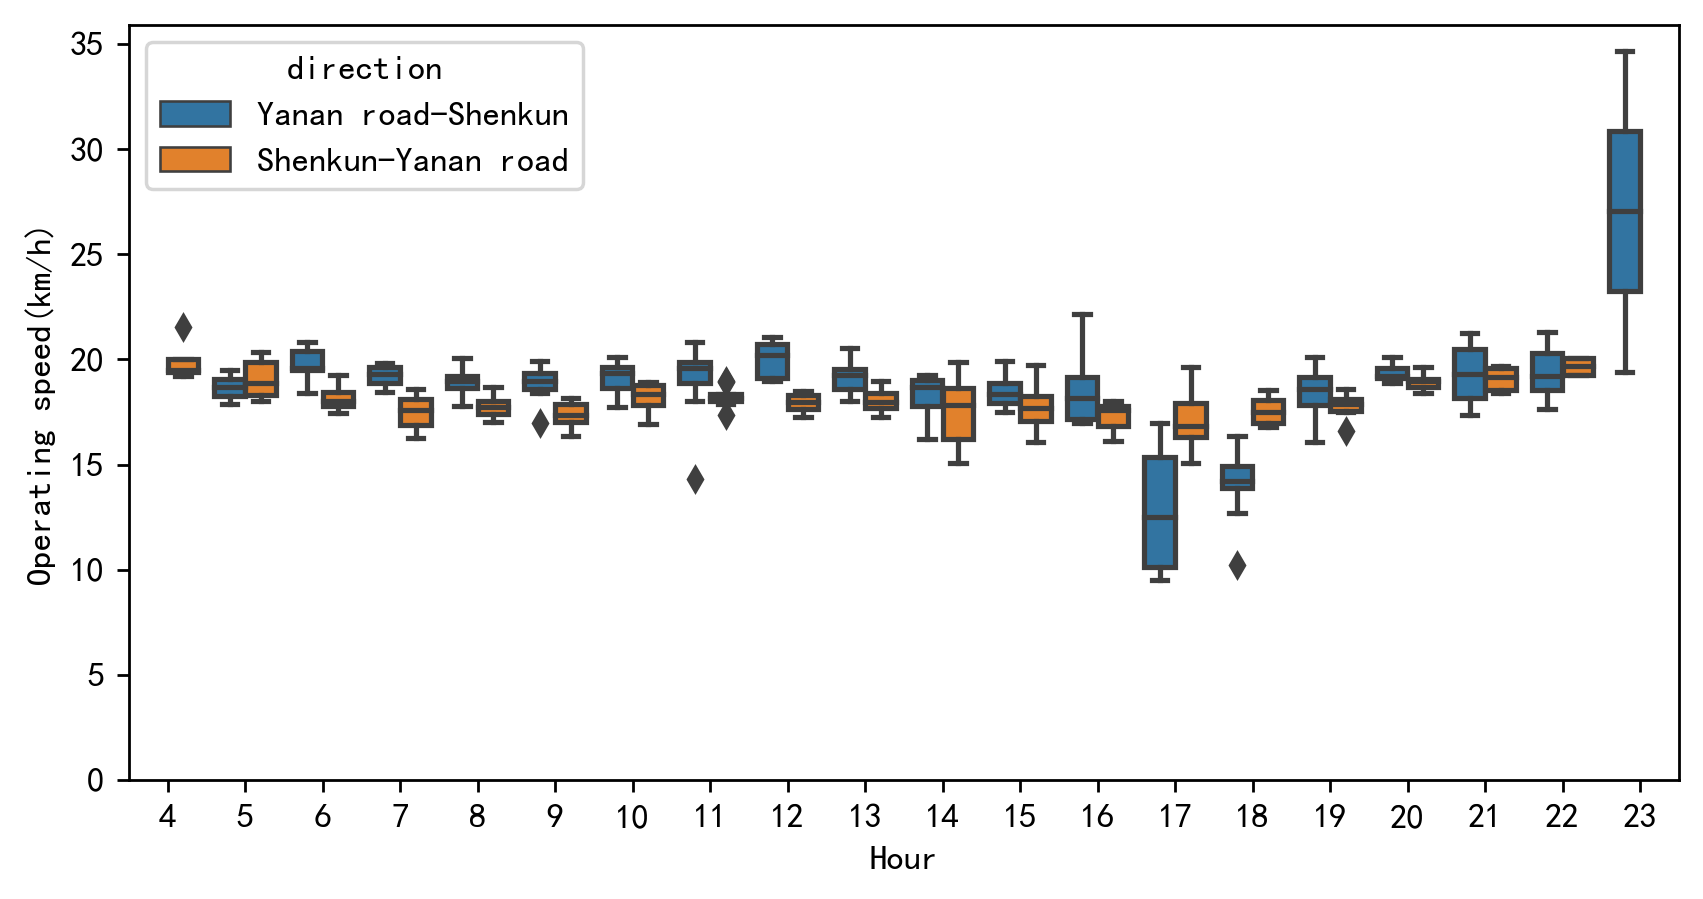
fig = plt.figure(1,(8,4),dpi = 250)
ax1 = plt.subplot(111)
sns.boxplot(x = 'shour',y = 'speed',hue = 'direction',data = onewaytime)
plt.ylabel('Operating speed(km/h)')
plt.xlabel('Hour')
plt.ylim(0)
plt.show()