9 公交 GPS 数据的到离站信息识别
要运行这个例子,你可能需要安装``seaborn``:
pip install seaborn
以下示例显示了如何使用 TransBigData 处理公交车 GPS 数据,包括识别公交车到达和离开信息、计算公交车的行驶时间和运行速度。
[1]:
import warnings
warnings.filterwarnings('ignore')
[2]:
import transbigdata as tbd
import pandas as pd
import geopandas as gpd
读取数据
读取公交车GPS数据
[3]:
BUS_GPS= pd.read_csv(r'data/busgps.csv',header = None)
BUS_GPS.columns = ['GPSDateTime', 'LineId', 'LineName', 'NextLevel', 'PrevLevel',
       'Strlatlon', 'ToDir', 'VehicleId', 'VehicleNo', 'unknow']
#Convert the time column to datetime type
BUS_GPS['GPSDateTime'] = pd.to_datetime(BUS_GPS['GPSDateTime'])
转换坐标
[4]:
#Slice the latitude and longitude string
BUS_GPS['lon'] = BUS_GPS['Strlatlon'].apply(lambda r:r.split(',')[0])
BUS_GPS['lat'] = BUS_GPS['Strlatlon'].apply(lambda r:r.split(',')[1])
#Convert coordinates
BUS_GPS['lon'],BUS_GPS['lat'] = tbd.gcj02towgs84(BUS_GPS['lon'].astype(float),BUS_GPS['lat'].astype(float))
BUS_GPS.head(5)
[4]:
| GPSDateTime | LineId | LineName | NextLevel | PrevLevel | Strlatlon | ToDir | VehicleId | VehicleNo | unknow | lon | lat | |
|---|---|---|---|---|---|---|---|---|---|---|---|---|
| 0 | 2019-01-16 23:59:59 | 7100 | 71 | 2 | 1 | 121.335413,31.173188 | 1 | 沪D-R7103 | Z5A-0021 | 1 | 121.330858 | 31.175129 |
| 1 | 2019-01-17 00:00:00 | 7100 | 71 | 2 | 1 | 121.334616,31.172271 | 1 | 沪D-R1273 | Z5A-0002 | 1 | 121.330063 | 31.174214 |
| 2 | 2019-01-17 00:00:00 | 7100 | 71 | 24 | 23 | 121.339955,31.173025 | 0 | 沪D-R5257 | Z5A-0020 | 1 | 121.335390 | 31.174958 |
| 3 | 2019-01-17 00:00:01 | 7100 | 71 | 14 | 13 | 121.409491,31.20433 | 0 | 沪D-R5192 | Z5A-0013 | 1 | 121.404843 | 31.206179 |
| 4 | 2019-01-17 00:00:03 | 7100 | 71 | 15 | 14 | 121.398615,31.200253 | 0 | 沪D-T0951 | Z5A-0022 | 1 | 121.393966 | 31.202103 |
读取公交线路数据
[5]:
shp = r'data/busline.json'
linegdf = gpd.GeoDataFrame.from_file(shp,encoding = 'gbk')
line = linegdf.iloc[:1].copy()
line.plot()
[5]:
<AxesSubplot:>
读取公交站台数据
[6]:
shp = r'data/busstop.json'
stop = gpd.GeoDataFrame.from_file(shp,encoding = 'gbk')
stop = stop[stop['linename'] == '71路(延安东路外滩-申昆路枢纽站)']
stop.plot()
[6]:
<AxesSubplot:>
识别到达和离开信息
[7]:
arriveinfo = tbd.busgps_arriveinfo(BUS_GPS,line,stop)
Cleaning data...
Position matching......
Matching arrival and leaving info.........................................................................................................................................................
[8]:
arriveinfo
[8]:
| arrivetime | leavetime | stopname | VehicleId | |
|---|---|---|---|---|
| 0 | 2019-01-17 07:19:42 | 2019-01-17 07:31:14 | 延安东路外滩 | 1 |
| 1 | 2019-01-17 09:53:08 | 2019-01-17 10:09:34 | 延安东路外滩 | 1 |
| 0 | 2019-01-17 07:13:23 | 2019-01-17 07:15:45 | 西藏中路 | 1 |
| 1 | 2019-01-17 07:34:24 | 2019-01-17 07:35:38 | 西藏中路 | 1 |
| 2 | 2019-01-17 09:47:03 | 2019-01-17 09:50:22 | 西藏中路 | 1 |
| ... | ... | ... | ... | ... |
| 2 | 2019-01-17 16:35:52 | 2019-01-17 16:36:49 | 吴宝路 | 148 |
| 3 | 2019-01-17 19:21:09 | 2019-01-17 19:23:44 | 吴宝路 | 148 |
| 0 | 2019-01-17 13:36:26 | 2019-01-17 13:45:04 | 申昆路枢纽站 | 148 |
| 1 | 2019-01-17 15:52:26 | 2019-01-17 16:32:46 | 申昆路枢纽站 | 148 |
| 2 | 2019-01-17 19:24:54 | 2019-01-17 19:25:55 | 申昆路枢纽站 | 148 |
8984 rows × 4 columns
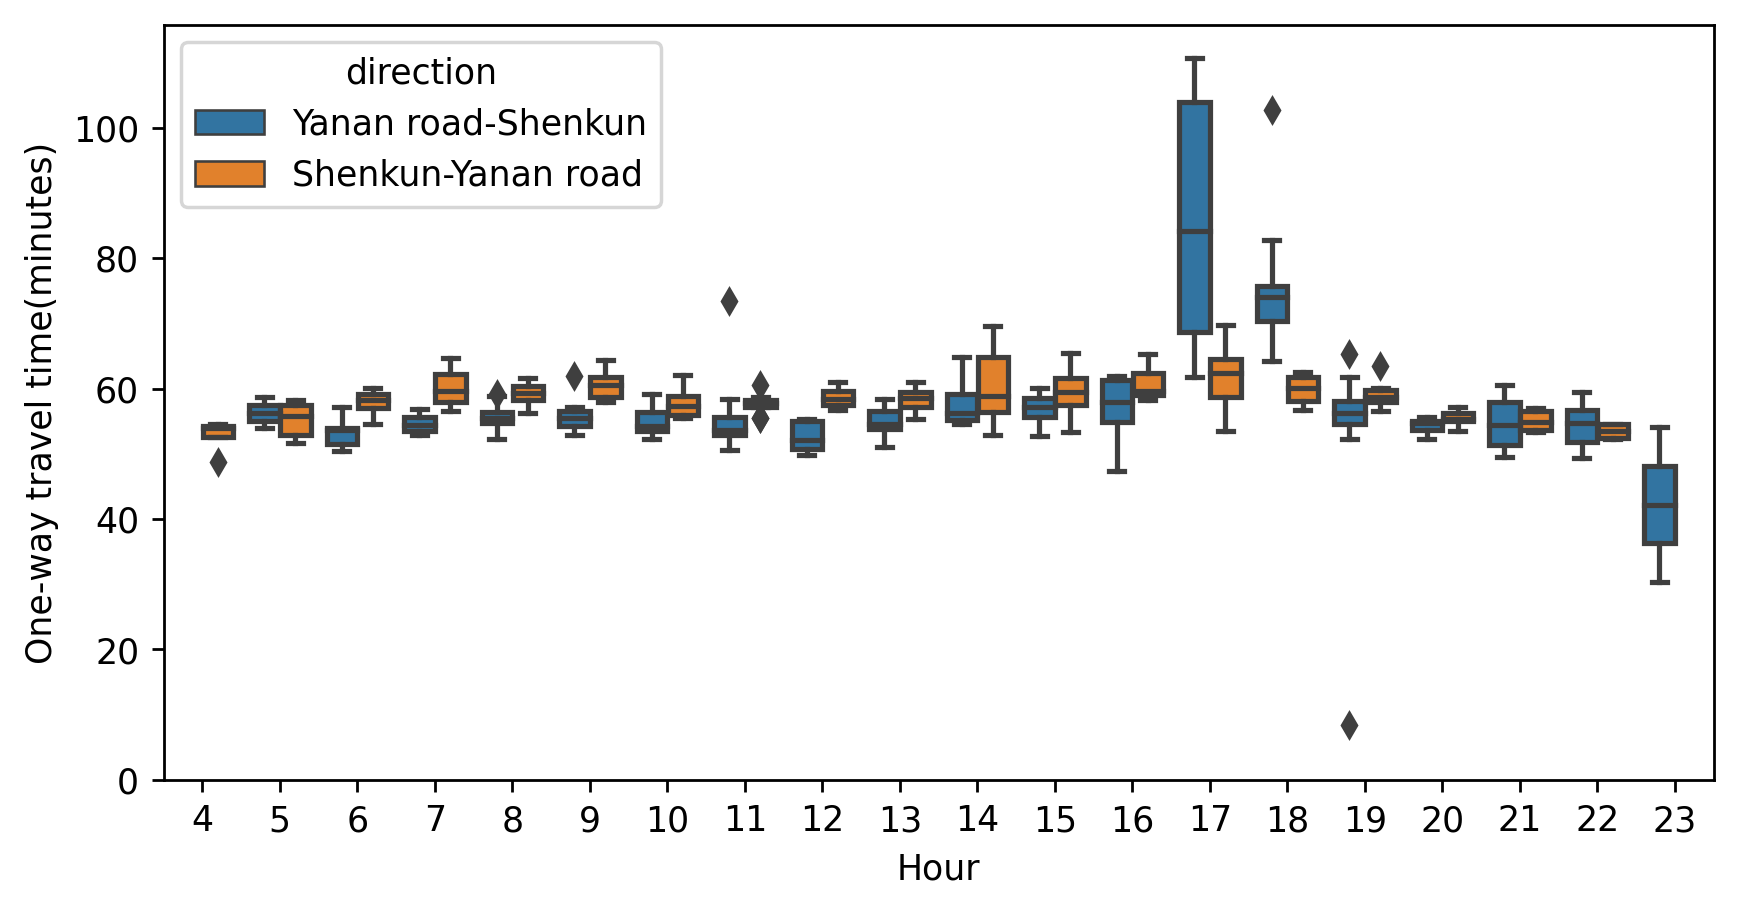
单程旅行时间
根据上面获得的“到达信息”计算单程旅行时间。给定公交线路的起点和终点站名称,“tbd.busgps_onewaytime”可以计算两个车站之间的行驶时间。
[9]:
onewaytime = tbd.busgps_onewaytime(arriveinfo,
                                   start = '延安东路外滩',
                                   end = '申昆路枢纽站',col = ['VehicleId','stopname', 'arrivetime', 'leavetime'])
[10]:
onewaytime
[10]:
| time | stopname | VehicleId | time1 | stopname1 | VehicleId1 | duration | shour | direction | |
|---|---|---|---|---|---|---|---|---|---|
| 0 | 2019-01-17 07:31:14 | 延安东路外滩 | 1 | 2019-01-17 08:24:42 | 申昆路枢纽站 | 1.0 | 3208.0 | 7 | 延安东路外滩-申昆路枢纽站 |
| 1 | 2019-01-17 10:09:34 | 延安东路外滩 | 1 | 2019-01-17 11:03:49 | 申昆路枢纽站 | 1.0 | 3255.0 | 10 | 延安东路外滩-申昆路枢纽站 |
| 0 | 2019-01-17 13:11:43 | 延安东路外滩 | 2 | 2019-01-17 14:05:17 | 申昆路枢纽站 | 2.0 | 3214.0 | 13 | 延安东路外滩-申昆路枢纽站 |
| 1 | 2019-01-17 15:42:28 | 延安东路外滩 | 2 | 2019-01-17 16:37:00 | 申昆路枢纽站 | 2.0 | 3272.0 | 15 | 延安东路外滩-申昆路枢纽站 |
| 0 | 2019-01-17 18:46:11 | 延安东路外滩 | 3 | 2019-01-17 19:51:54 | 申昆路枢纽站 | 3.0 | 3943.0 | 18 | 延安东路外滩-申昆路枢纽站 |
| ... | ... | ... | ... | ... | ... | ... | ... | ... | ... |
| 1 | 2019-01-17 17:11:43 | 申昆路枢纽站 | 144 | 2019-01-17 18:13:22 | 延安东路外滩 | 144.0 | 3699.0 | 17 | 申昆路枢纽站-延安东路外滩 |
| 0 | 2019-01-17 08:15:44 | 申昆路枢纽站 | 147 | 2019-01-17 09:14:46 | 延安东路外滩 | 147.0 | 3542.0 | 8 | 申昆路枢纽站-延安东路外滩 |
| 1 | 2019-01-17 10:51:34 | 申昆路枢纽站 | 147 | 2019-01-17 11:50:03 | 延安东路外滩 | 147.0 | 3509.0 | 10 | 申昆路枢纽站-延安东路外滩 |
| 0 | 2019-01-17 13:45:04 | 申昆路枢纽站 | 148 | 2019-01-17 14:44:03 | 延安东路外滩 | 148.0 | 3539.0 | 13 | 申昆路枢纽站-延安东路外滩 |
| 1 | 2019-01-17 16:32:46 | 申昆路枢纽站 | 148 | 2019-01-17 17:31:34 | 延安东路外滩 | 148.0 | 3528.0 | 16 | 申昆路枢纽站-延安东路外滩 |
375 rows × 9 columns
为了显示数字的英文,这里我们将车站名称和方向名称更改为英文:
[11]:
onewaytime.loc[onewaytime['stopname']=='延安东路外滩','stopname']="Yanan road station"
onewaytime.loc[onewaytime['stopname1']=='申昆路枢纽站','stopname1']="Shenkun station"
onewaytime.loc[onewaytime['direction']=='延安东路外滩-申昆路枢纽站','direction']="Yanan road-Shenkun"
onewaytime.loc[onewaytime['direction']=='申昆路枢纽站-延安东路外滩','direction']="Shenkun-Yanan road"
[12]:
## Draw box plot for one-way travel time
import numpy as np
import matplotlib.pyplot as plt
import seaborn as sns
fig     = plt.figure(1,(8,4),dpi = 250)
ax1      = plt.subplot(111)

sns.boxplot(x = 'shour',y = onewaytime['duration']/60,hue = 'direction',data = onewaytime)

plt.ylabel('One-way travel time(minutes)')
plt.xlabel('Hour')
plt.ylim(0)
plt.show()
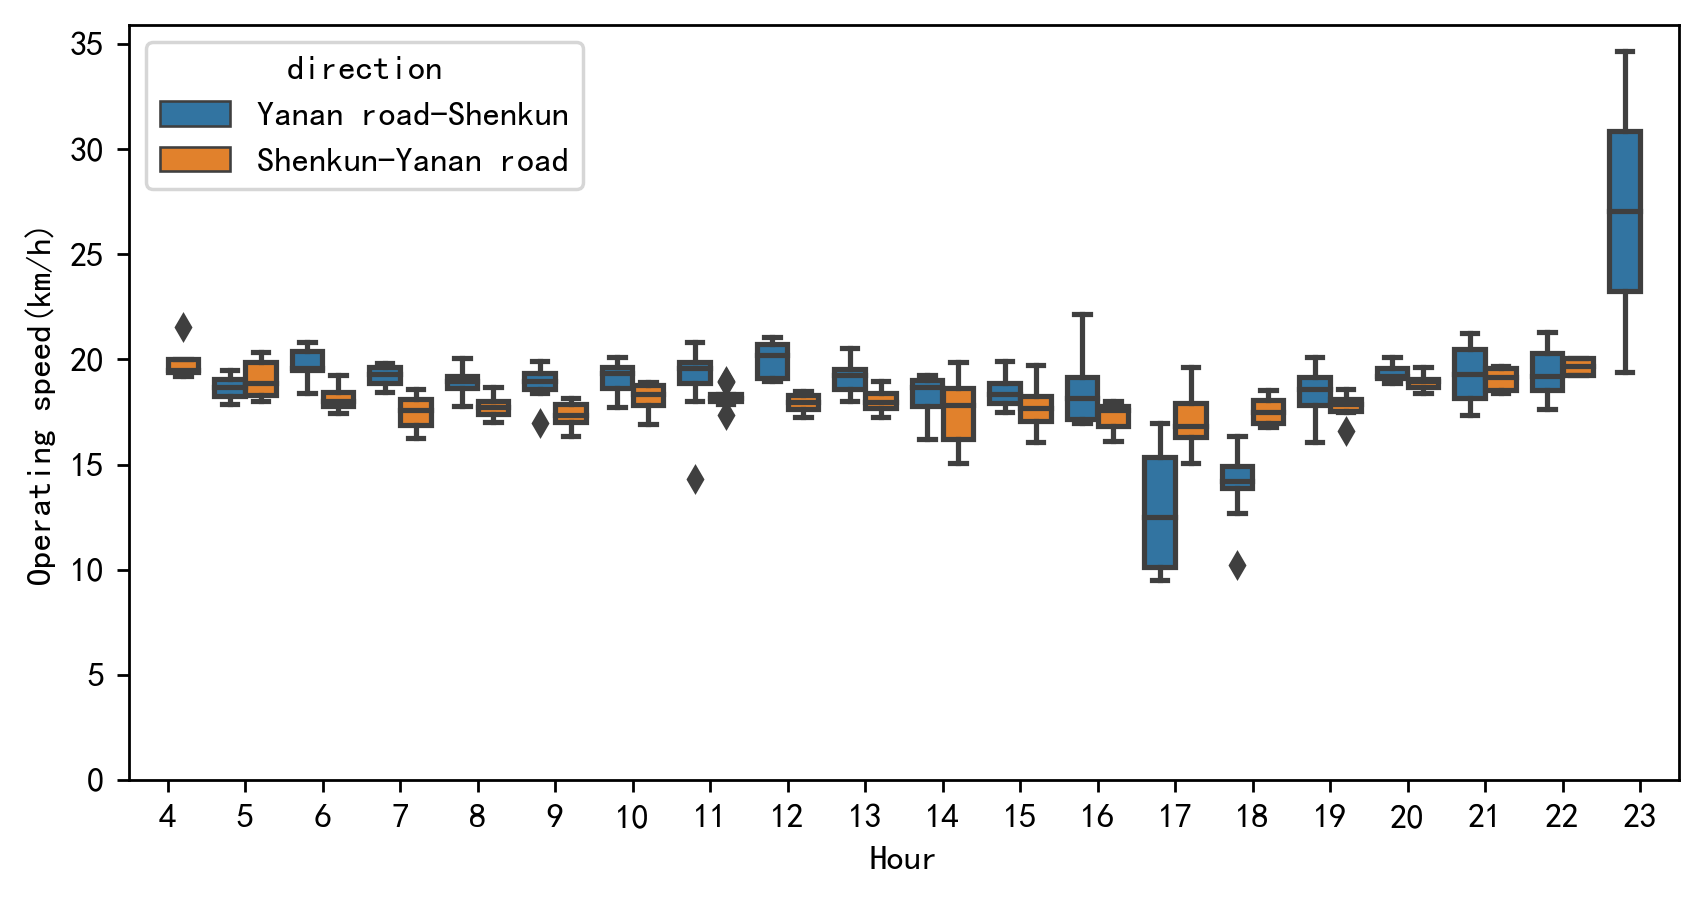
公交车的行驶速度
[13]:
#Convert coordinate system to projection coordinate system for later calculation of distance
line.crs = {'init':'epsg:4326'}
line_2416 = line.to_crs(epsg = 2416)
#Obtain the geometry inside the bus route data
lineshp = line_2416['geometry'].iloc[0]
linename = line_2416['name'].iloc[0]
lineshp
[13]:

[14]:
#Remove the data with abnormal speed
#Vehicle speed units converted to km/h
onewaytime['speed'] = (lineshp.length/onewaytime['duration'])*3.6
onewaytime = onewaytime[onewaytime['speed']<=60]
[15]:
## Travel speed distribution
import numpy as np
import matplotlib.pyplot as plt
import seaborn as sns
plt.rcParams['font.sans-serif']=['SimHei']
plt.rcParams['font.serif'] = ['SimHei']
plt.rcParams['axes.unicode_minus']=False
fig     = plt.figure(1,(8,4),dpi = 250)
ax1      = plt.subplot(111)
sns.boxplot(x = 'shour',y = 'speed',hue = 'direction',data = onewaytime)
plt.ylabel('Operating speed(km/h)')
plt.xlabel('Hour')
plt.ylim(0)
plt.show()