GIS处理
|
在dfB_origin中搜索最近的点以查找dfA_origin,并计算距离 |
|
此方法会将 gdfB 中最近的点与 gdfA 匹配,并添加一个名为 dist 的新列 |
|
此方法将从 gdfB 进行搜索,以找到离 gdfA 中点最近的线。 |
|
输入是线的GeoDataFrame。 |
|
输入的是多边形几何的GeoDataFrame,col名。 |
|
输入是多边形几何的GeoDataFrame。 |
近邻配料
- transbigdata.ckdnearest(dfA_origin, dfB_origin, Aname=['lon', 'lat'], Bname=['lon', 'lat'])
在dfB_origin中搜索最近的点以查找dfA_origin,并计算距离
- 参数:
dfA_origin (DataFrame) – 数据帧A
dfB_origin (DataFrame) – 数据帧B
Aname (List) – DataFrame A中lng和lat的列
Bname (List) – DataFrame A中lng和lat的列
- 返回:
gdf – 输出数据帧
- 返回类型:
DataFrame
- transbigdata.ckdnearest_point(gdA, gdB)
此方法会将 gdfB 中最近的点与 gdfA 匹配,并添加一个名为 dist 的新列
- 参数:
gdA (GeoDataFrame) – GeoDataFrame A,点几何
gdB (GeoDataFrame) – GeoDataFrame B,点几何
- 返回:
gdf – 输出数据帧
- 返回类型:
DataFrame
- transbigdata.ckdnearest_line(gdfA, gdfB)
此方法将从 gdfB 进行搜索,以找到离 gdfA 中点最近的线。
- 参数:
gdA (GeoDataFrame) – GeoDataFrame A,点几何
gdB (GeoDataFrame) – GeoDataFrame B,线串几何
- 返回:
gdf – 在 gdfB 中的近线串中搜索 gdfA 中的点
- 返回类型:
DataFrame
点对点匹配(DataFrame与DataFrame)
In [1]: import transbigdata as tbd

In [2]: import pandas as pd

In [3]: import geopandas as gpd

In [4]: from shapely.geometry import LineString

In [5]: dfA = gpd.GeoDataFrame([[1,2],[2,4],[2,6],
   ...:                         [2,10],[24,6],[21,6],
   ...:                         [22,6]],columns = ['lon1','lat1'])
   ...:

In [6]: dfA
Out[6]:
   lon1  lat1
0     1     2
1     2     4
2     2     6
3     2    10
4    24     6
5    21     6
6    22     6

In [7]: dfB = gpd.GeoDataFrame([[1,3],[2,5],[2,2]],columns = ['lon','lat'])

In [8]: dfB
Out[8]:
   lon  lat
0    1    3
1    2    5
2    2    2
In [9]: tbd.ckdnearest(dfA,dfB,Aname=['lon1','lat1'],Bname=['lon','lat'])
Out[9]:
   lon1  lat1  index  lon  lat          dist
0     1     2      0    1    3  1.111949e+05
1     2     4      1    2    5  1.111949e+05
2     2     6      1    2    5  1.111949e+05
3     2    10      1    2    5  5.559746e+05
4    24     6      1    2    5  2.437393e+06
5    21     6      1    2    5  2.105798e+06
6    22     6      1    2    5  2.216318e+06
点与点匹配(GeoDataFrame与GeoDataFrame)
将A表B表变为包含点信息的GeoDataFrame
In [10]: dfA['geometry'] = gpd.points_from_xy(dfA['lon1'],dfA['lat1'])

In [11]: dfA
Out[11]:
   lon1  lat1                  geometry
0     1     2   POINT (1.00000 2.00000)
1     2     4   POINT (2.00000 4.00000)
2     2     6   POINT (2.00000 6.00000)
3     2    10  POINT (2.00000 10.00000)
4    24     6  POINT (24.00000 6.00000)
5    21     6  POINT (21.00000 6.00000)
6    22     6  POINT (22.00000 6.00000)

In [12]: dfB['geometry'] = gpd.points_from_xy(dfB['lon'],dfB['lat'])

In [13]: dfB
Out[13]:
   lon  lat                 geometry
0    1    3  POINT (1.00000 3.00000)
1    2    5  POINT (2.00000 5.00000)
2    2    2  POINT (2.00000 2.00000)
In [14]: tbd.ckdnearest_point(dfA,dfB)
Out[14]:
   lon1  lat1                geometry_x  ...  lon  lat               geometry_y
0     1     2   POINT (1.00000 2.00000)  ...    1    3  POINT (1.00000 3.00000)
1     2     4   POINT (2.00000 4.00000)  ...    2    5  POINT (2.00000 5.00000)
2     2     6   POINT (2.00000 6.00000)  ...    2    5  POINT (2.00000 5.00000)
3     2    10  POINT (2.00000 10.00000)  ...    2    5  POINT (2.00000 5.00000)
4    24     6  POINT (24.00000 6.00000)  ...    2    5  POINT (2.00000 5.00000)
5    21     6  POINT (21.00000 6.00000)  ...    2    5  POINT (2.00000 5.00000)
6    22     6  POINT (22.00000 6.00000)  ...    2    5  POINT (2.00000 5.00000)

[7 rows x 8 columns]
点与线匹配(GeoDataFrame与GeoDataFrame)
将A表变为地理点,B表为线
In [15]: dfA['geometry'] = gpd.points_from_xy(dfA['lon1'],dfA['lat1'])

In [16]: dfB['geometry'] = [LineString([[1,1],[1.5,2.5],[3.2,4]]),
   ....:                    LineString([[1,0],[1.5,0],[4,0]]),
   ....:                     LineString([[1,-1],[1.5,-2],[4,-4]])]
   ....:

In [17]: dfB
Out[17]:
   lon  lat                                           geometry  index
0    1    3  LINESTRING (1.00000 1.00000, 1.50000 2.50000, ...      0
1    2    5  LINESTRING (1.00000 0.00000, 1.50000 0.00000, ...      1
2    2    2  LINESTRING (1.00000 -1.00000, 1.50000 -2.00000...      2

In [18]: tbd.ckdnearest_line(dfA,dfB)
Out[18]:
   lon1  lat1  ... lat                                         geometry_y
0     1     2  ...   3  LINESTRING (1.00000 1.00000, 1.50000 2.50000, ...
1     2     4  ...   3  LINESTRING (1.00000 1.00000, 1.50000 2.50000, ...
2     2     6  ...   3  LINESTRING (1.00000 1.00000, 1.50000 2.50000, ...
3     2    10  ...   3  LINESTRING (1.00000 1.00000, 1.50000 2.50000, ...
4    21     6  ...   3  LINESTRING (1.00000 1.00000, 1.50000 2.50000, ...
5    22     6  ...   3  LINESTRING (1.00000 1.00000, 1.50000 2.50000, ...
6    24     6  ...   5  LINESTRING (1.00000 0.00000, 1.50000 0.00000, ...

[7 rows x 8 columns]
打断线
在现实应用中,我们可能需要把很长的线打断为很多子线段,每一条线段不要超过一定的最大长度,此时则可以使用TransBigData包中的splitline_with_length方法。
- transbigdata.splitline_with_length(Centerline, maxlength=100)
输入是线串 GeoDataFrame。分割线的长度不长于最大长度
- 参数:
Centerline (GeoDataFrame) – 线串几何
maxlength (number) – 分割线的最大长度
- 返回:
splitedline – 分割线
- 返回类型:
GeoDataFrame
下面显示如何将线打断为100米一段的线段
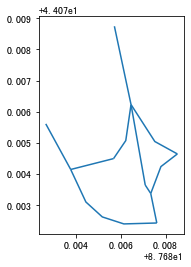
#读取线要素
import geopandas as gpd
Centerline = gpd.read_file(r'test_lines.json')
Centerline.plot()
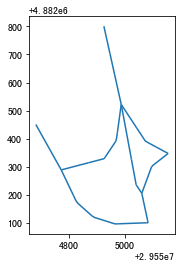
#转换线为投影坐标系
Centerline.crs = {'init':'epsg:4326'}
Centerline = Centerline.to_crs(epsg = '4517')
#计算线的长度
Centerline['length'] = Centerline.length
Centerline
| Id | geometry | length | |
|---|---|---|---|
| 0 | 0 | LINESTRING (29554925.232 4882800.694, 29554987... | 285.503444 |
| 1 | 0 | LINESTRING (29554682.635 4882450.554, 29554773... | 185.482276 |
| 2 | 0 | LINESTRING (29554987.079 4882521.969, 29555040... | 291.399180 |
| 3 | 0 | LINESTRING (29554987.079 4882521.969, 29555073... | 248.881529 |
| 4 | 0 | LINESTRING (29554987.079 4882521.969, 29554969... | 207.571197 |
| 5 | 0 | LINESTRING (29554773.177 4882288.671, 29554828... | 406.251357 |
| 6 | 0 | LINESTRING (29554773.177 4882288.671, 29554926... | 158.114403 |
| 7 | 0 | LINESTRING (29555060.286 4882205.456, 29555082... | 107.426629 |
| 8 | 0 | LINESTRING (29555040.278 4882235.468, 29555060... | 36.069941 |
| 9 | 0 | LINESTRING (29555060.286 4882205.456, 29555095... | 176.695446 |
#将线打断为最长100米的线段
import transbigdata as tbd
splitedline = tbd.splitline_with_length(Centerline,maxlength = 100)
#打断后线型不变
splitedline.plot()
#但内容已经变成一段一段了
splitedline
| geometry | id | length | |
|---|---|---|---|
| 0 | LINESTRING (29554925.232 4882800.694, 29554927... | 0 | 100.000000 |
| 1 | LINESTRING (29554946.894 4882703.068, 29554949... | 0 | 100.000000 |
| 2 | LINESTRING (29554968.557 4882605.443, 29554970... | 0 | 85.503444 |
| 0 | LINESTRING (29554682.635 4882450.554, 29554688... | 1 | 100.000000 |
| 1 | LINESTRING (29554731.449 4882363.277, 29554736... | 1 | 85.482276 |
| 0 | LINESTRING (29554987.079 4882521.969, 29554989... | 2 | 100.000000 |
| 1 | LINESTRING (29555005.335 4882423.650, 29555007... | 2 | 100.000000 |
| 2 | LINESTRING (29555023.592 4882325.331, 29555025... | 2 | 91.399180 |
| 0 | LINESTRING (29554987.079 4882521.969, 29554993... | 3 | 100.000000 |
| 1 | LINESTRING (29555042.051 4882438.435, 29555048... | 3 | 99.855617 |
| 2 | LINESTRING (29555111.265 4882370.450, 29555116... | 3 | 48.881529 |
| 0 | LINESTRING (29554987.079 4882521.969, 29554985... | 4 | 100.000000 |
| 1 | LINESTRING (29554973.413 4882422.908, 29554971... | 4 | 99.756943 |
| 2 | LINESTRING (29554930.341 4882335.023, 29554929... | 4 | 7.571197 |
| 0 | LINESTRING (29554773.177 4882288.671, 29554777... | 5 | 100.000000 |
| 1 | LINESTRING (29554816.361 4882198.476, 29554821... | 5 | 99.782969 |
| 2 | LINESTRING (29554882.199 4882125.314, 29554891... | 5 | 99.745378 |
| 3 | LINESTRING (29554976.612 4882096.588, 29554987... | 5 | 100.000000 |
| 4 | LINESTRING (29555076.548 4882100.189, 29555077... | 5 | 6.251357 |
| 0 | LINESTRING (29554773.177 4882288.671, 29554783... | 6 | 100.000000 |
| 1 | LINESTRING (29554869.914 4882314.006, 29554876... | 6 | 58.114403 |
| 0 | LINESTRING (29555060.286 4882205.456, 29555062... | 7 | 100.000000 |
| 1 | LINESTRING (29555081.239 4882107.675, 29555081... | 7 | 7.426629 |
| 0 | LINESTRING (29555040.278 4882235.468, 29555042... | 8 | 36.069941 |
| 0 | LINESTRING (29555060.286 4882205.456, 29555064... | 9 | 100.000000 |
| 1 | LINESTRING (29555094.981 4882299.244, 29555100... | 9 | 76.419694 |
多边形处理
- transbigdata.merge_polygon(data, col)
输入是面几何的地理数据帧和列名称。此函数将根据上述列中的类别合并多边形
- 参数:
data (GeoDataFrame) – 多边形几何
col (str) – 表示类别的列名
- 返回:
data1 – 合并后的多边形
- 返回类型:
GeoDataFrame
- transbigdata.polyon_exterior(data, minarea=0)
输入是面几何的地理数据帧。该方法将通过扩展 ploygon 的外部边界来构造新的多边形
- 参数:
data (GeoDataFrame) – 多边形几何
minarea (number) – 最小面积。
- 返回:
data1 – 处理后的多边形
- 返回类型:
GeoDataFrame