载入底图
|
绘制底图 |
|
为地图添加指南针和比例尺 |
|
|
|
设置地图保存路径 |
读取地图保存路径 |
|
读取mapboxtoken |
启动前设置
如果已经获取了 mapbox的access token,可以使用以下代码为 TransBigData 设置 mapbox的access token(只需要设置一次,以后重新打开 python 时不需要重新设置)
import transbigdata as tbd
#Set your mapboxtoken with the following code
tbd.set_mapboxtoken('pk.eyxxxxxxxxxx.xxxxxxxxx')
# The token you applied for must be set in it.
# Copying this line of code directly is invalid
此外,还需要设置地图底图的存储位置。下次显示相同位置时,将在本地读取和加载地图
# Set your map basemap storage path
# On linux or mac, the path is written like this.
# Note that there is a backslash at the end
tbd.set_imgsavepath(r'/Users/xxxx/xxxx/')

# On windows, the path is written like this.
# Finally, pay attention to two slashes to prevent escape
tbd.set_imgsavepath(r'E:\pythonscript\xxx\\')
设置完成后,下次绘制底图时,会在设置的路径下创建一个tileimg文件夹,并将所有底图放入其中。尝试以下代码,看看是否可以成功绘制底图
# Define display range
bounds = [113.6,22.4,114.8,22.9]
# Plot Frame
import matplotlib.pyplot as plt
fig =plt.figure(1,(8,8),dpi=250)
ax =plt.subplot(111)
plt.sca(ax)
# Add map basemap
tbd.plot_map(plt,bounds,zoom = 11,style = 4)
# Add scale bar and north arrow
tbd.plotscale(ax,bounds = bounds,textsize = 10,compasssize = 1,accuracy = 2000,rect = [0.06,0.03],zorder = 10)
plt.axis('off')
plt.xlim(bounds[0],bounds[2])
plt.ylim(bounds[1],bounds[3])
plt.show()
- transbigdata.plot_map(plt, bounds, zoom='auto', style=0, printlog=False)
绘制底图
- 参数:
plt (matplotlib.pyplot) – 在哪里绘制
bounds (List) – 底图的绘制边界 [lon1,lat1,lon2,lat2](WGS84 坐标系),其中 lon1 和 lat1 是左下角的坐标,lon2 和 lat2 是右上角的坐标
zoom (number) – 底图的放大倍率越大,加载时间越长。通常,单个城市的范围在 12 到 16 之间
printlog (bool) – 显示日志
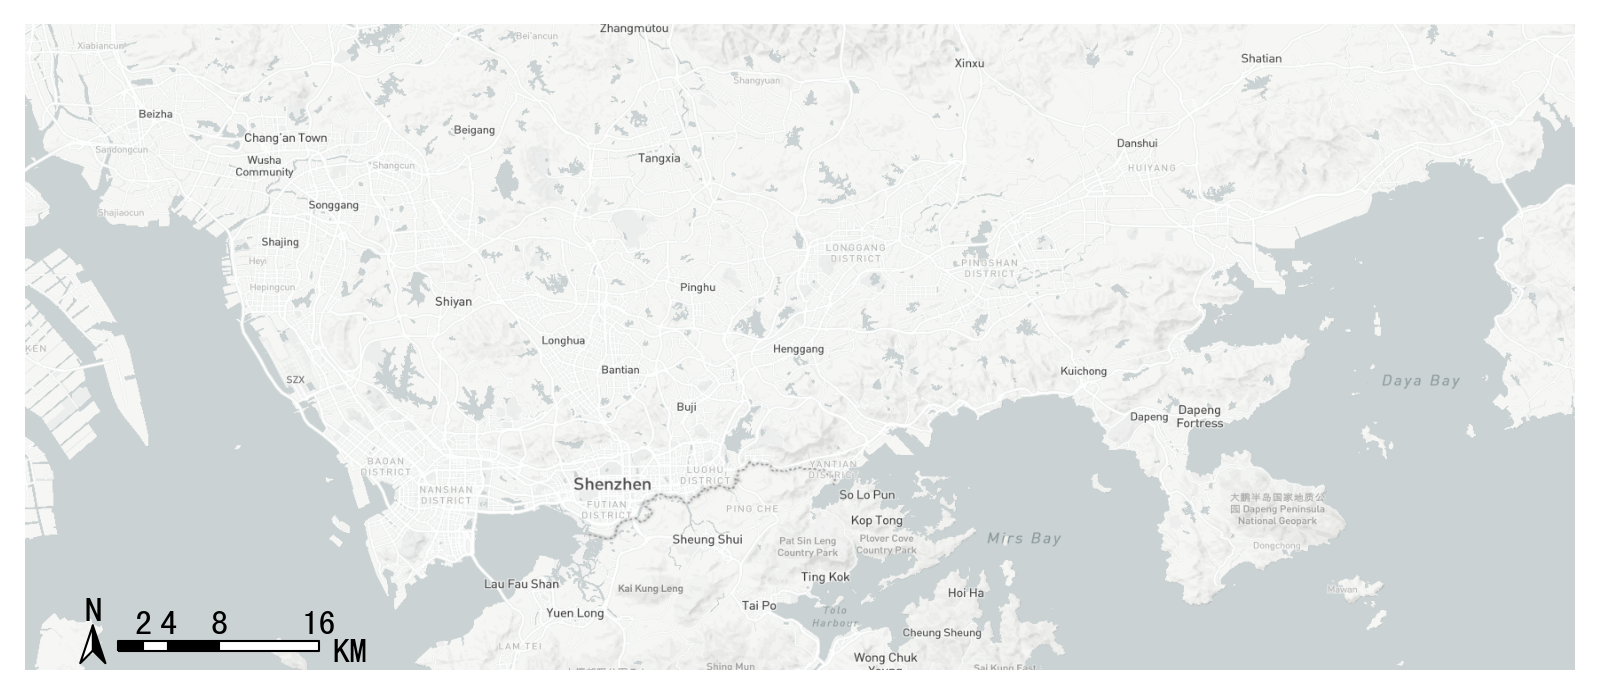
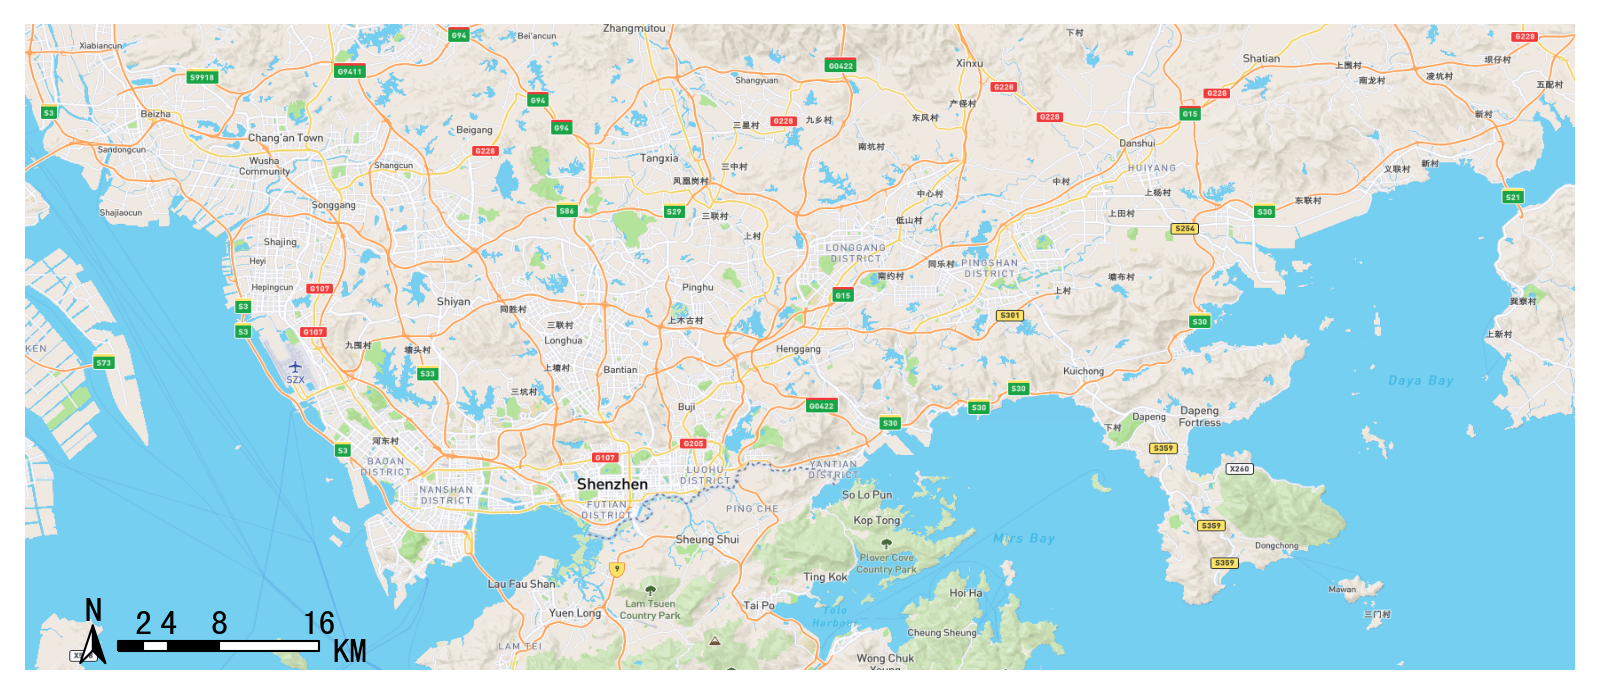
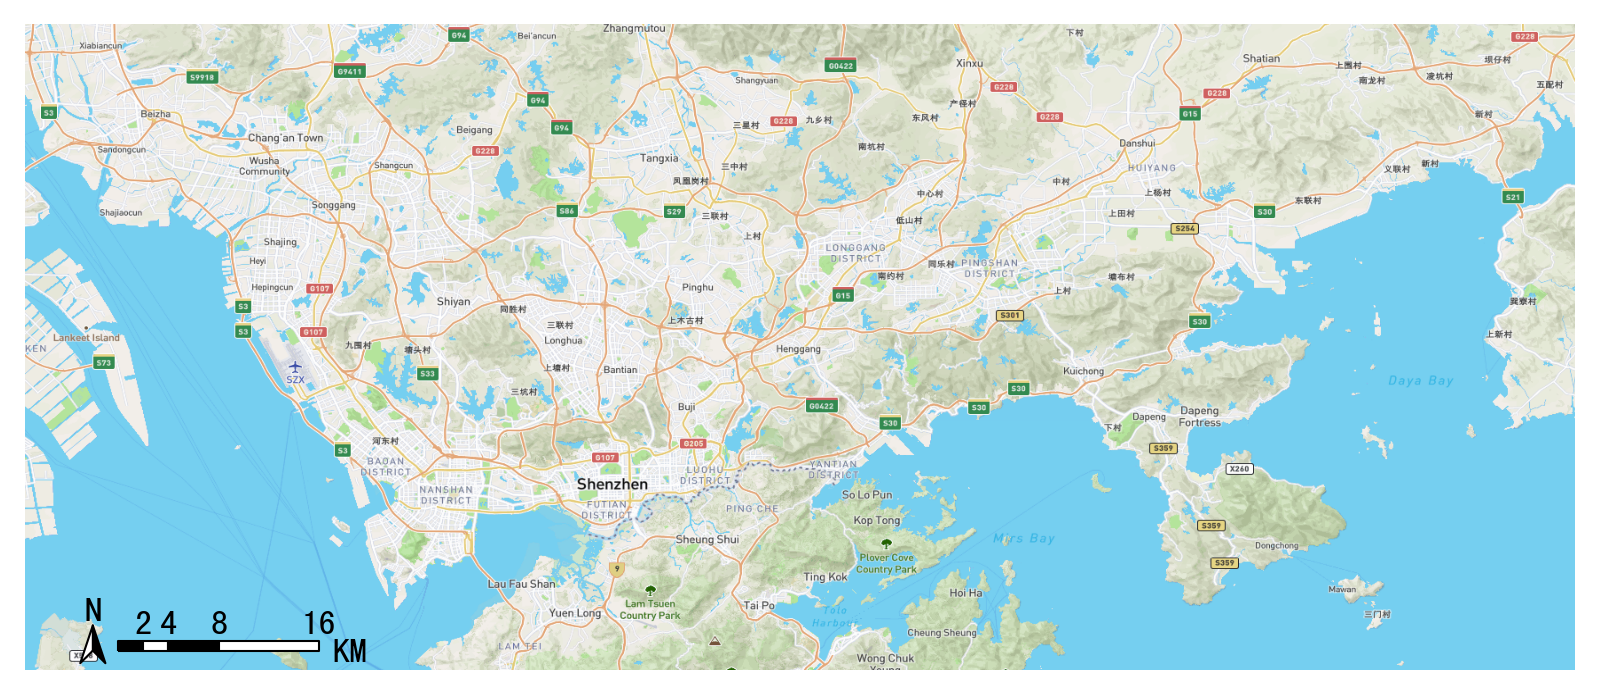
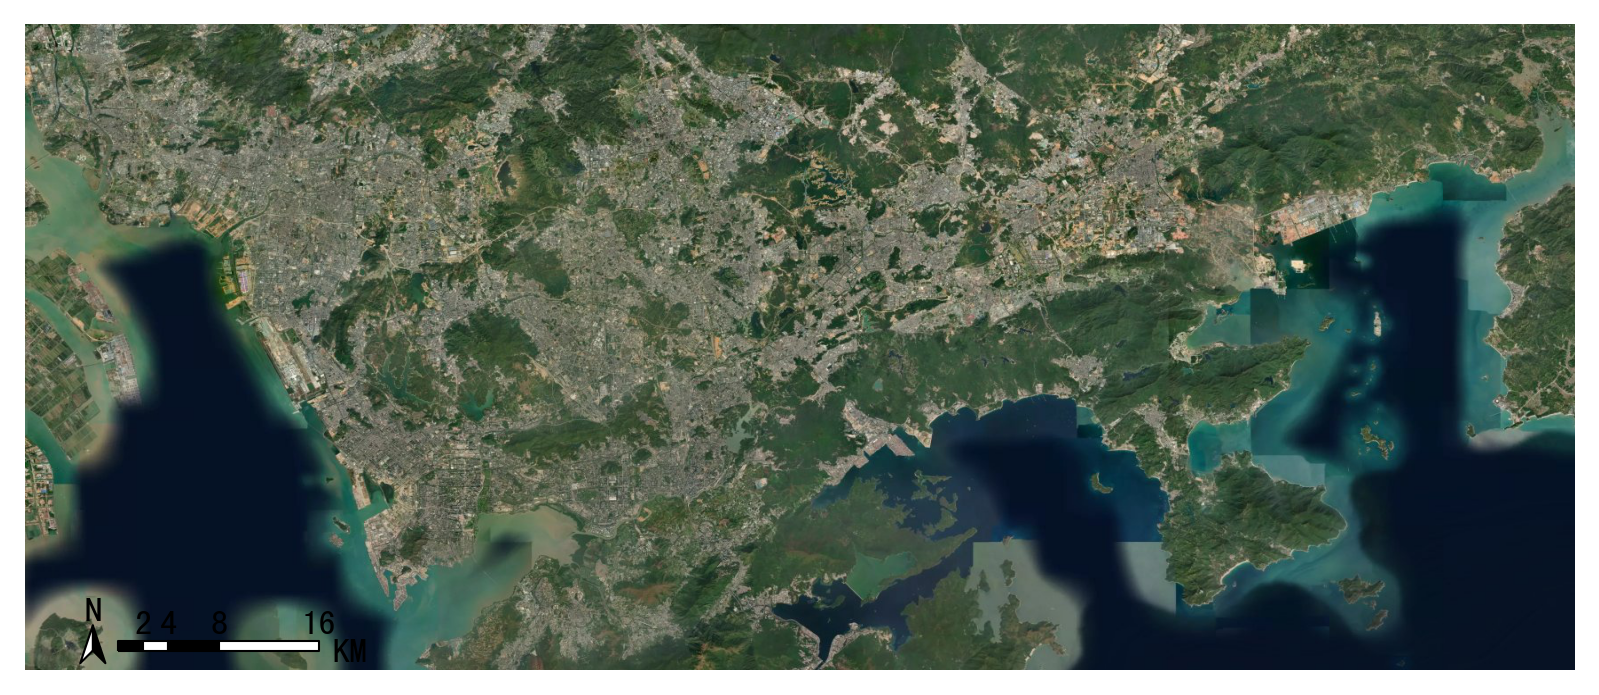
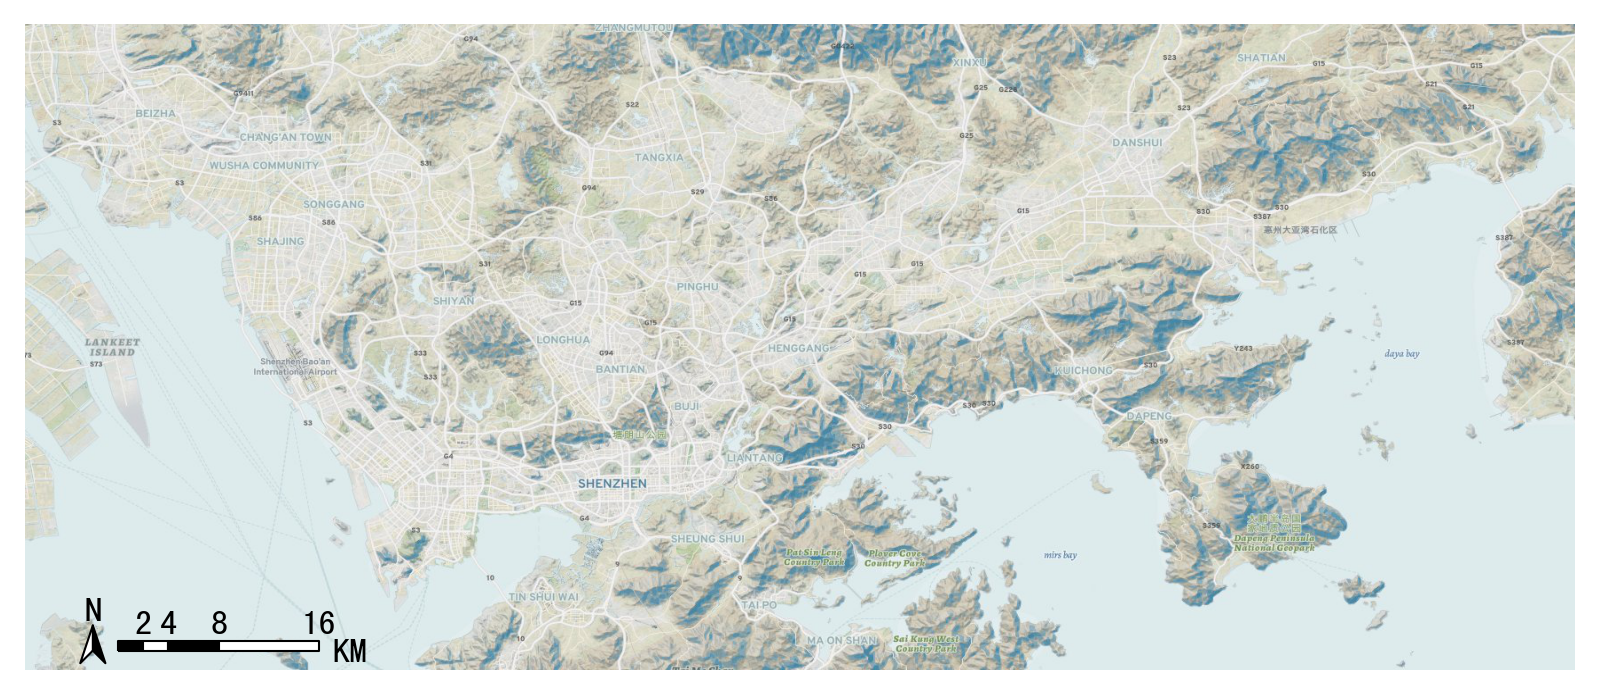
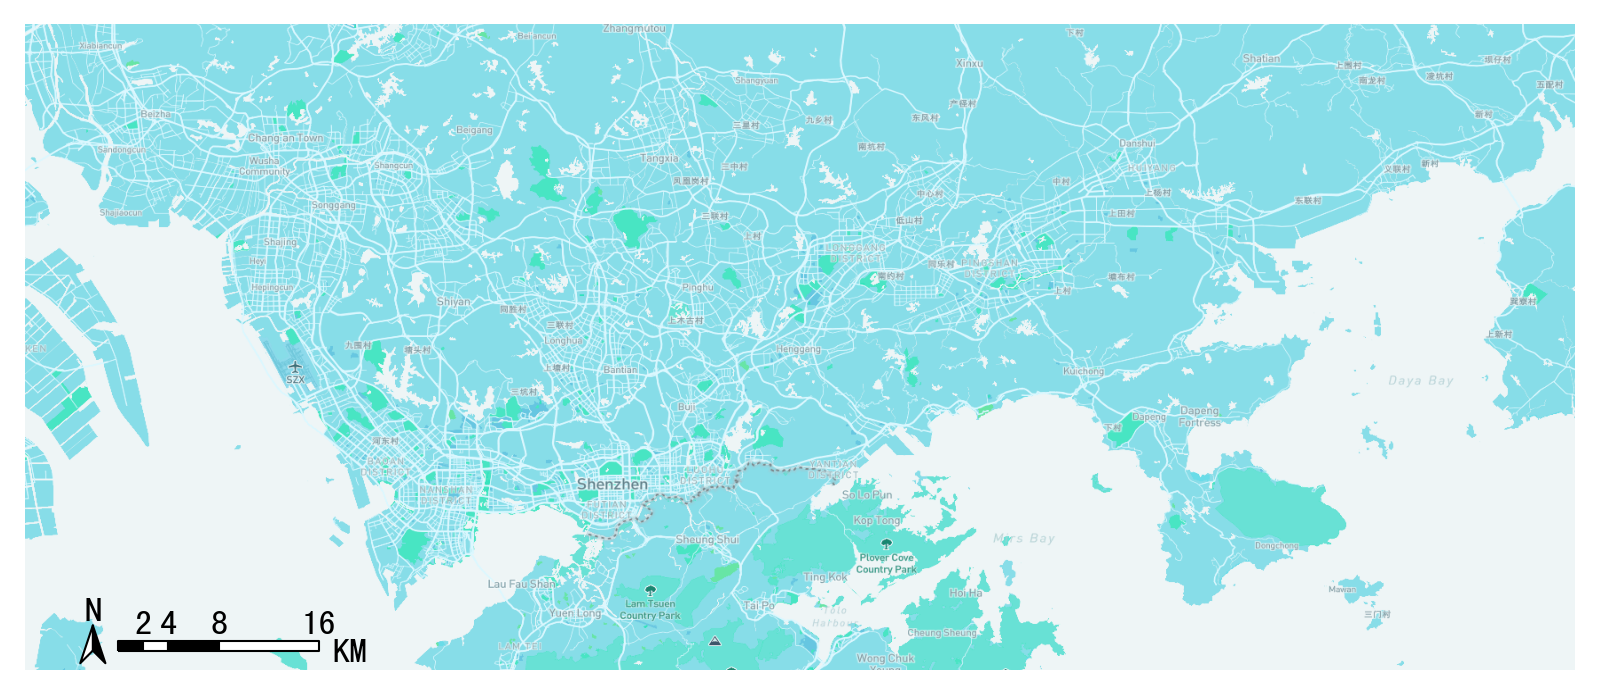
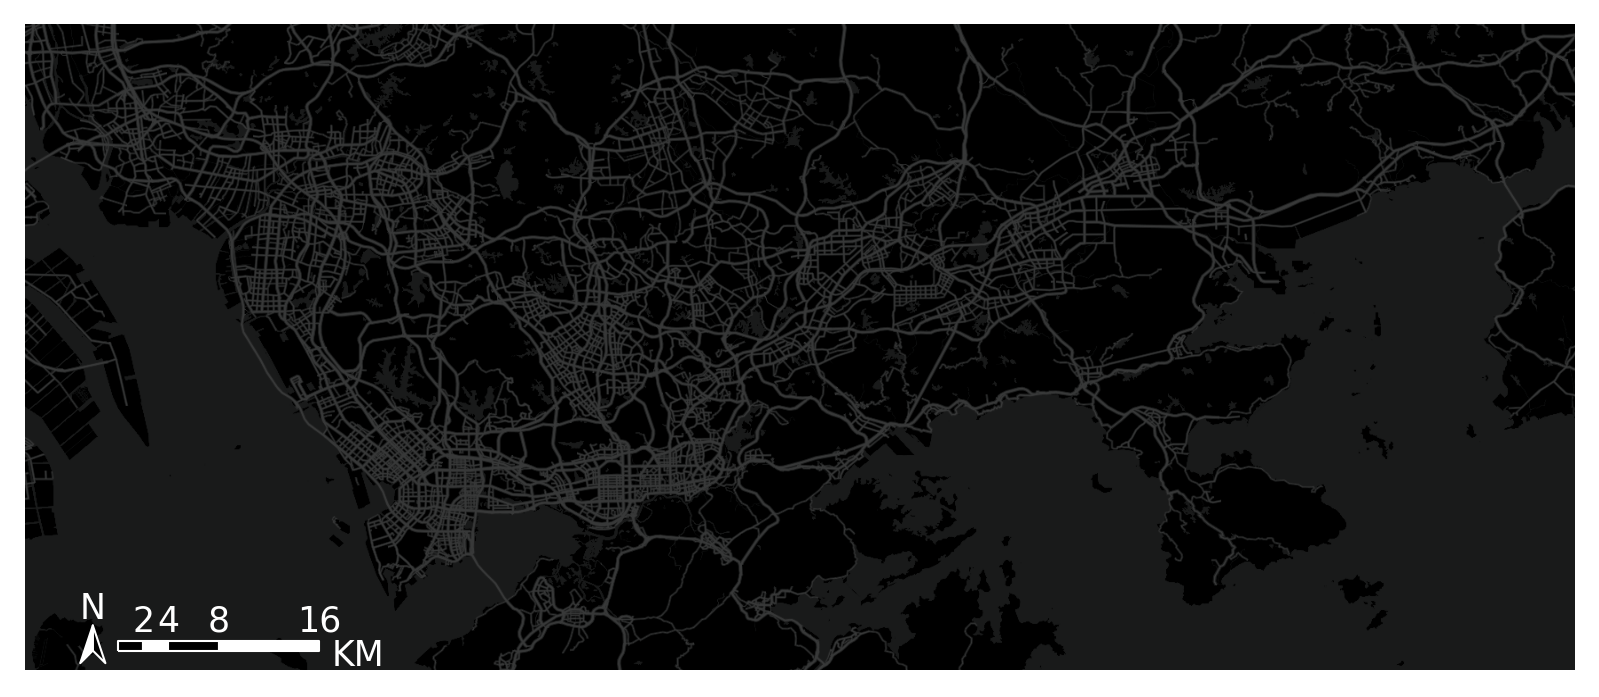
style (number) – 地图底图的样式可以是1-10,如下
底图样式1:街道
底图样式2:户外
底图样式3:卫星
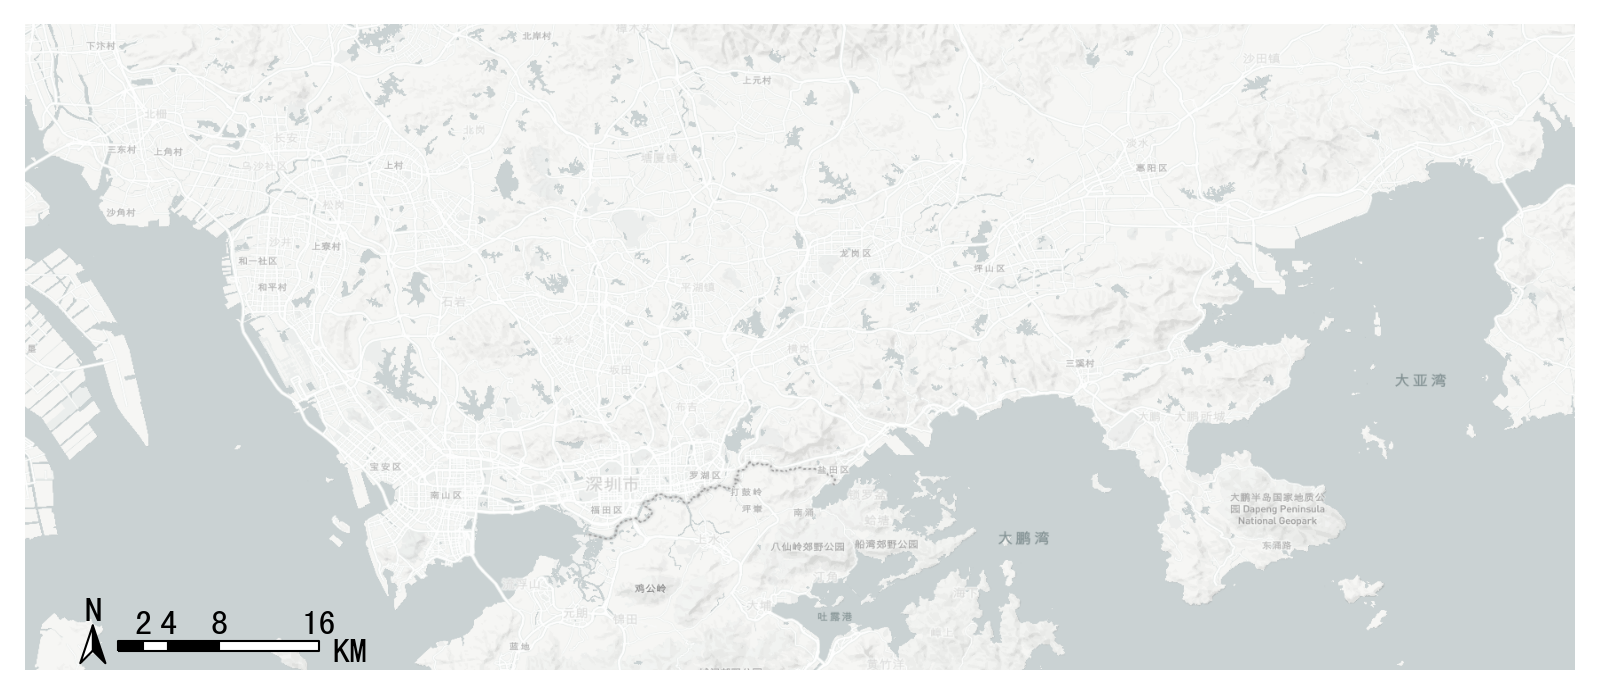
底图样式4:浅色

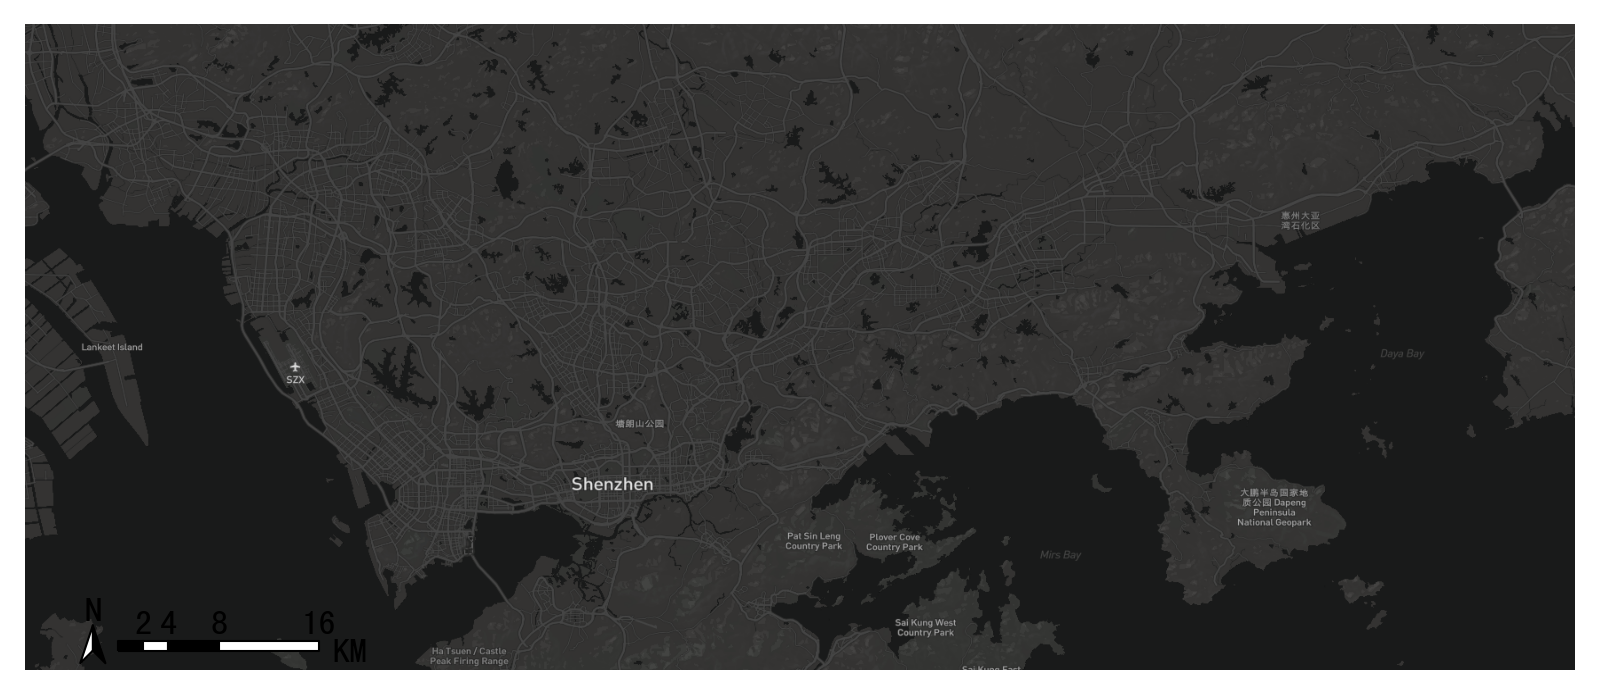
底图样式5:深色
底图样式6:light-ch(中文)
底图样式7:冰淇淋
底图样式8:夜景
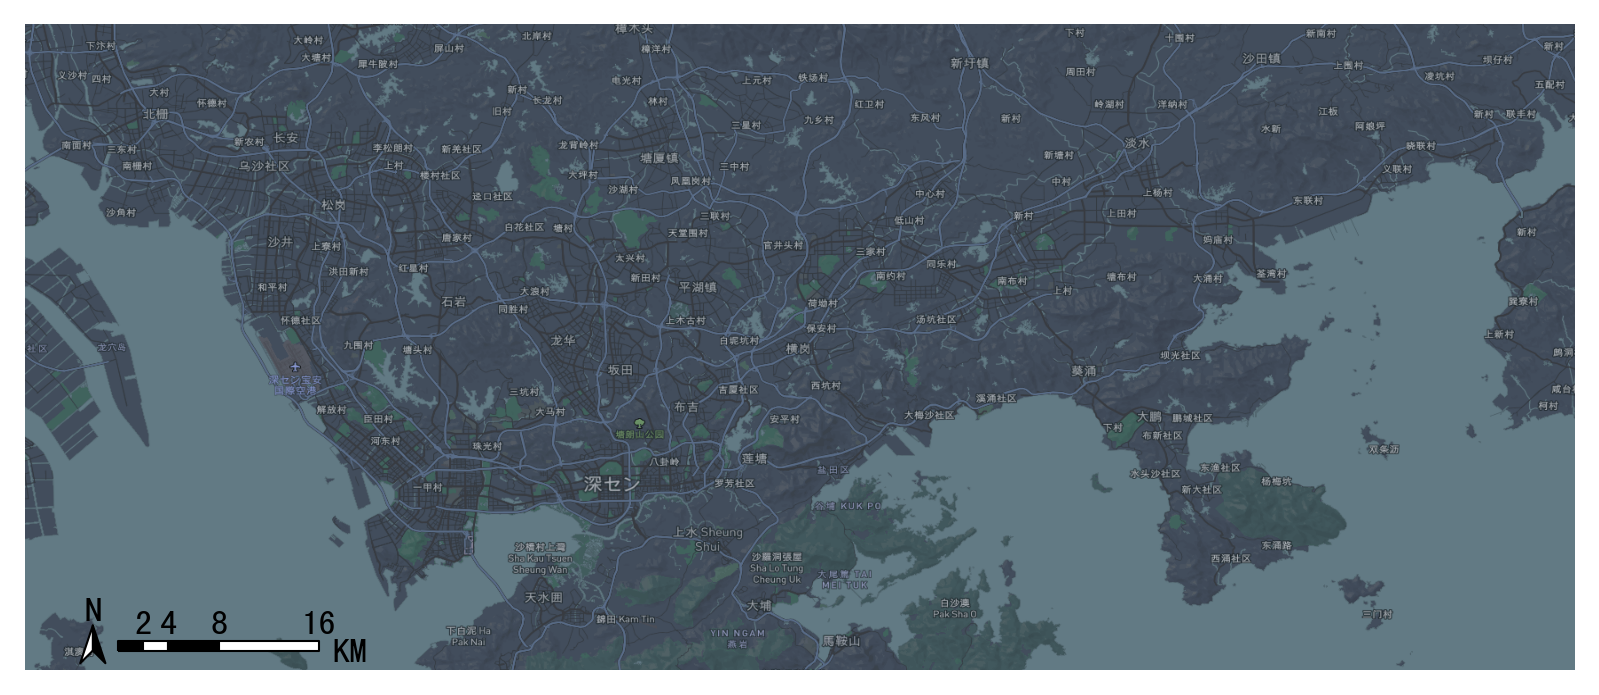
底图样式9:地形
底图样式 10:基础蓝
底图样式 11:light(无标记)

底图样式 12:深色(无标记)
自定义样式
支持自定义mapbox样式
tbd.plot_map(plt,bounds,zoom = 11,style = 'mapbox://styles/ni1o1/cl38pljx0006r14qp7ioy7gcc')
指南针和刻度
- transbigdata.plotscale(ax, bounds, textcolor='k', textsize=8, compasssize=1, accuracy='auto', rect=[0.1, 0.1], unit='KM', style=1, **kwargs)
为地图添加指南针和比例尺
- 参数:
bounds (List) – 底图的绘制边界 [lon1,lat1,lon2,lat2](WGS84 坐标系),其中 lon1 和 lat1 是左下角的坐标,lon2 和 lat2 是右上角的坐标
textsize (number) – 文本的大小
compasssize (number) – 指南针的大小
accuracy (number) – 比例尺长度(m)
unit (str) – ‘KM’,’km’,’M’,’m’, 刻度单位
style (number) – 1 或 2,比例的样式
rect (List) – 图中比例尺的大致位置,如[0.9,0.9],在右上角
tbd.plotscale(ax,bounds = bounds,textsize = 10,compasssize = 1,accuracy = 2000,rect = [0.06,0.03])